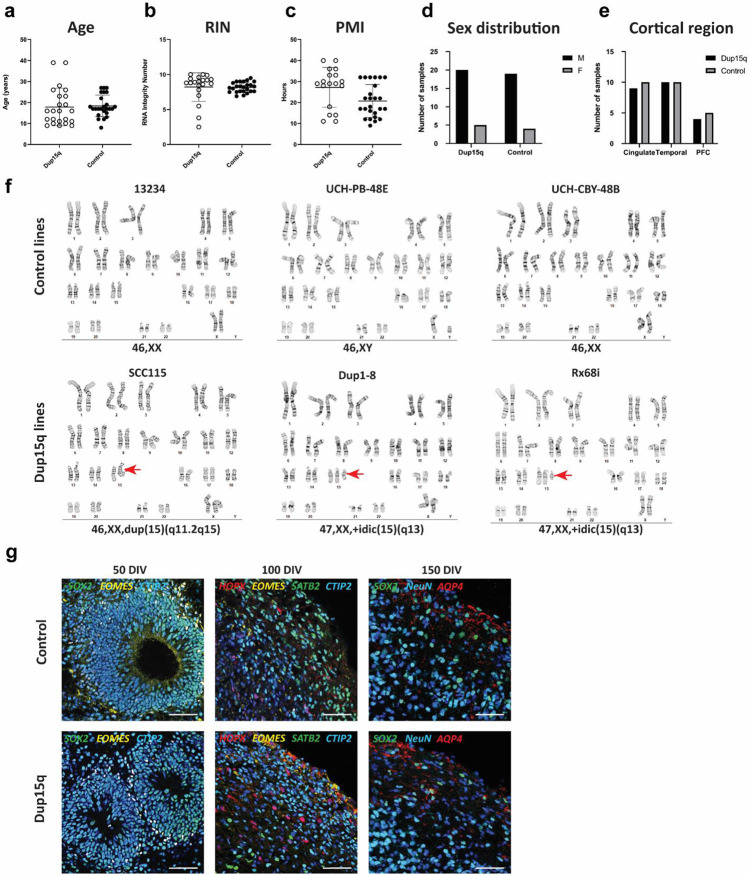
Extended Data Figure 1. Sample statistics for experimental groups, iPSC karyotype and organoid development.
a-e) Comparison of age, RNA integrity number (RIN), post-mortem interval (PMI), sex, and brain regions between control and dup15q groups. f) G-banding karyotype analysis of all iPSC lines used in the study. g) Immunostainings of organoid sections at three sampling developmental timepoints (50, 100 and 150 days of in-vitro development, scale bar = 50μm).

