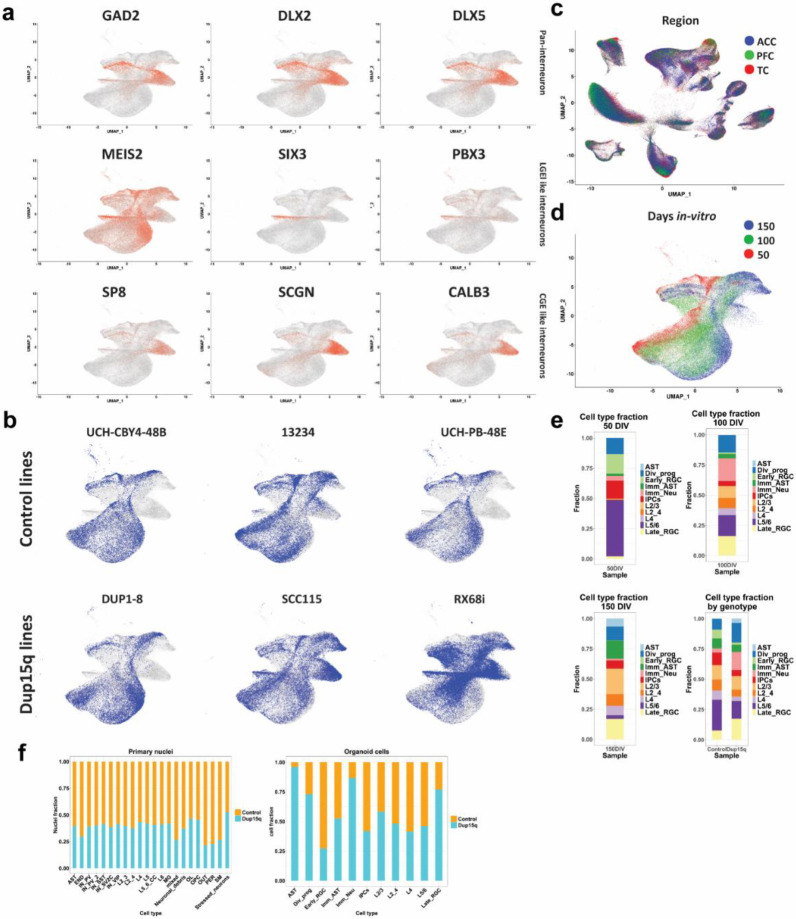
Extended Data Figure 3. Organoid interneuron identification and cell-type proportions.
a) Organoid marker gene expression identifies interneuron subtypes. b) Contribution of each line to specific organoid cell types. c) UMAP of all primary cell-types grouped by cortical region. d) UMAP of cell-types grouped by differentiation timepoint. e) Organoid cell type contribution for each differentiation timepoint, and between genotypes for all timepoints combined. f) Cell-type fraction from all primary nuclei and organoid cells type by genotype.

