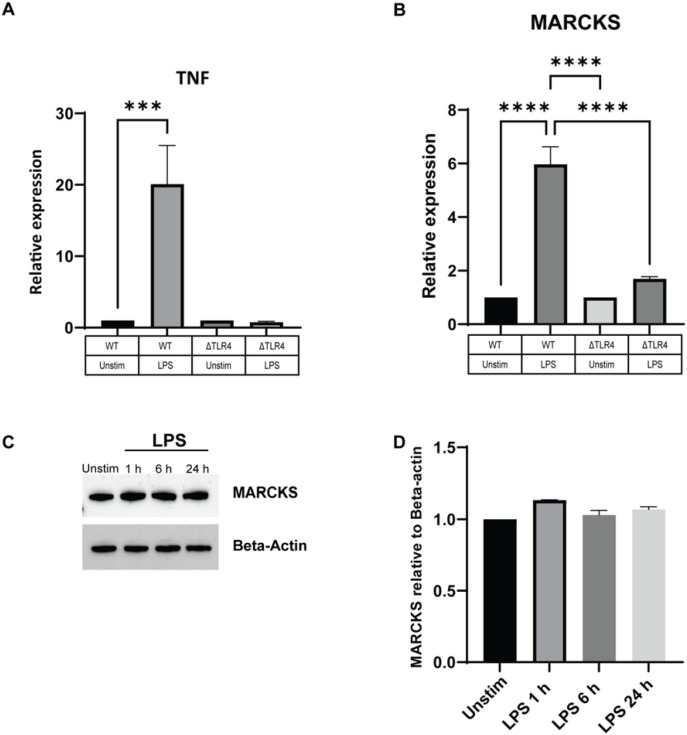
Figure 4. LPS induces MARCKS expression through the TLR4 dependent pathway.
A, B) WT IMMs and ΔTLR4 IMMs were treated with LPS for 6 hours or left unstimulated (indicated as “unstim” in this and subsequent panels). TNF and MARCKS mRNA levels were measured using real-time PCR. Data are representative of two independent experiments and shown as mean ± SEM: ***p<0.005, **** p< 0.0001 (one-way ANOVA).
C) ΔTLR4 IMMs were treated with LPS for the indicated times. MARCKS protein expression was detected by western blot and beta-actin was used as a loading control. The full-length blot image is included in the Supplementary Information file, Supplementary Figure 3.
D) Densitometric analysis of western blot results. MARCKS was normalized to beta-actin. Data are representative of 2 independent experiments, shown as mean ± SEM.

