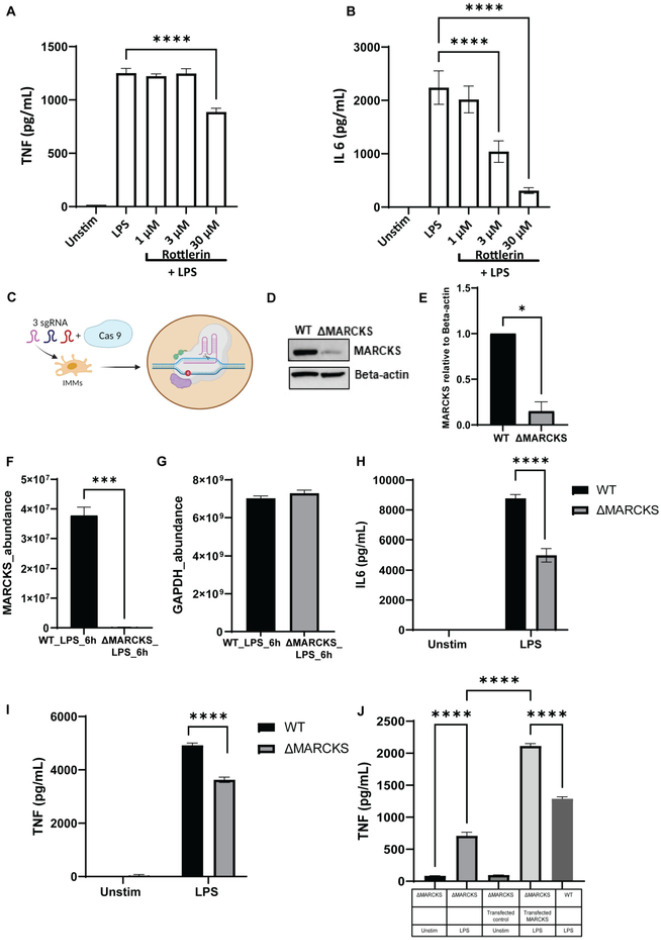
Figure 5. MARCKS deficient macrophages downregulate pro-inflammatory cytokine production.
A, B) WT IMMs were pre-treated with PKC inhibitor rottlerin for 1 hours, and then treated with LPS for 6 h or left unstimulated (indicated as “unstim” in this and subsequent panels). TNF and IL6 were measured by ELISA. Data are representative of two independent experiments and shown as mean ± SEM: **** p< 0.0001 (one-way ANOVA).
C) The schematic of the experimental strategy for CRISPR CAS9 mediated MARCKS knockout in macrophages.
D) Cell lysates of WT and ΔMARCKS IMMs were used analyzed by western blot to compare MARCKS protein expression level and beta-actin was used as a loading control. The full-length blot image is included in the Supplementary Information file, Supplementary Figure 3.
E) Densitometric analysis of western blot results. MARCKS was normalized to beta-actin. Data are representative of 2 independent experiments, shown as mean ± SEM. * p< 0.05 (unpaired t test).
F, G) Comparison of the MARCKS protein abundance between WT and ΔMARCKS IMMs obtained from mass spectrometry (F). GAPDH was used as a housekeeping protein control (G). The sum of the LC-MS peptide peak area was used as a measure of relative protein abundance.
H, I) WT and ΔMARCKS IMMs were treated with LPS (100 ng/mL) for 24 hours, and IL6 (H) or TNF (I) was measured by ELISA. Data are representative of 2 independent experiments and shown as mean ± SEM: **** p< 0.0001 (two-way ANOVA).
J) WT, ΔMARCKS IMMs and ΔMARCKS knock-in IMMs were treated with LPS (100 ng/mL) for 24 hours, TNF was measured by ELISA. Data are representative of 2 independent experiments and shown as men ± SEM: **** p< 0.0001 (one-way ANOVA).

