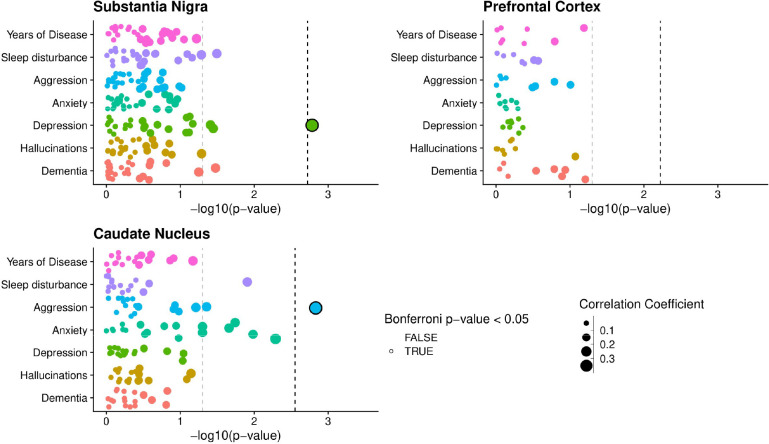
Figure 2: Co-methylation network association to sub symptom occurrence in PD.
Points represent individual module eigengenes for the substantia nigra (n = 27), frontal cortex (n = 8) and caudate nucleus (n = 18), repeatedly tested using correlation analysis in association with traits displayed along the y axis. Points are colored by the trait they are being tested for association with and sized by the absolute correlation coefficient value of the association. For clinical binary traits Spearman’s correlation was used, whilst for years of disease Pearson’s correlation was used. The −log10(p-value) of the association tests is displayed along the X-axis. The gray dashed line represents P-value = 0.05, whilst the Black dashed line represents the Bonferroni correction threshold for each brain region, controlling for the number of tests within each trait association, equivalent to 0.05 divided by the number of module eigengenes per region (SN: P < 0.0019, CN: P < 0.0028, FC P < 0.006).

