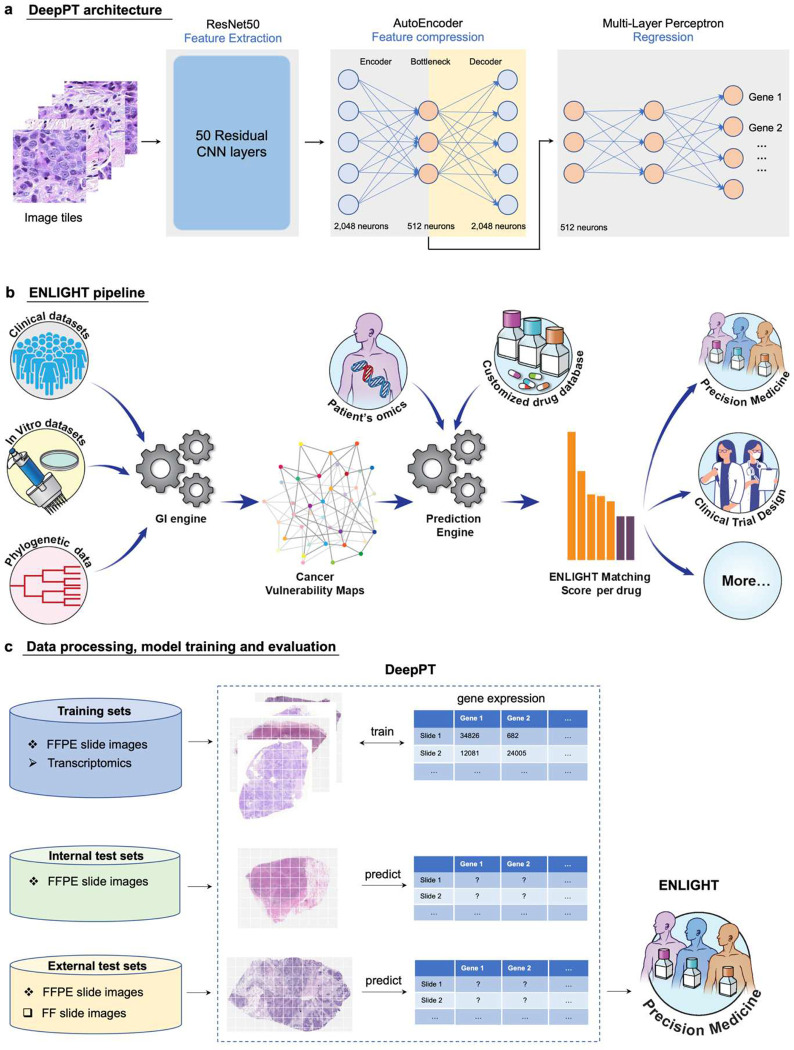
Figure 1. Study overview.
(a) The three main components of DeepPT architecture, from left to right. The pre-trained ResNet50 CNN unit extracts histopathology features from tile images. The autoencoder compresses the 2,048 features to a lower dimension of 512 features. The multi-layer perceptron integrates these histopathology features to predict the sample’s gene expression. (b) An overview of the ENLIGHT pipeline (illustration taken from [44]: ENLIGHT starts by inferring the genetic interaction partners of a given drug from various cancer in-vitro and clinical data sources. Given the SL and SR partners and the transcriptomics for a given patient sample, ENLIGHT computes a drug matching score that is used to predict the patient response. Here, ENLIGHT uses DeepPT predicted expression to produce drug matching scores for each patient studied. (c) Overview of the Analysis employing DeepPT and ENLIGHT: (i) top row: DeepPT was trained with formalin-fixed paraffin-embedded (FFPE) slide images and matched transcriptomics for an array of different cancer types from the TCGA. (ii) Middle row: After the training phase, the models were applied to predict gene expression on the internal (held-out) TCGA datasets and on two external datasets on which they were never trained. (iii) Bottom row: The predicted tumor transcriptomics in each five independent test clinical datasets serves as input to ENLIGHT for predicting the patients’ response to treatment and assessing the overall prediction accuracy.

