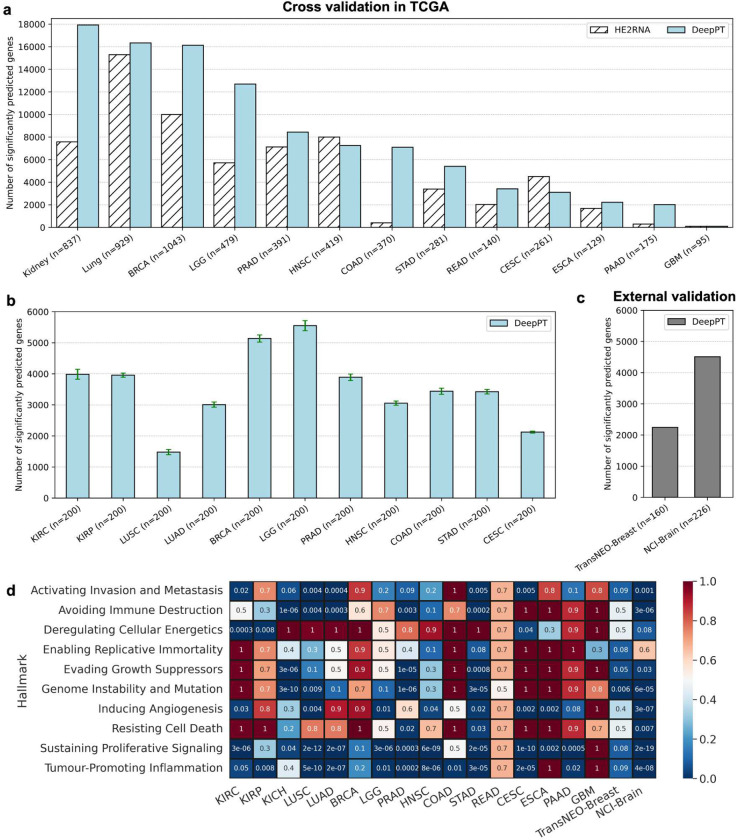
Figure 2. DeepPT prediction of gene expression from H&E slides.
(a) The number of significantly predicted genes for each TCGA cohort, in comparison with the current state-of-the-art method, HE2RNA. For apples-to-apples comparison against HE2RNA, the performance of each cancer subtypes in Kidney (KIRC, KIRP, KICH) and Lung (LUSC, LUAD) are shown together, as reported in [41]. (b) The number of significantly predicted genes, averaging over 30 randomly selected subsets. Each subset comprises 200 samples that were randomly selected from the cohort. Only cohorts with at least 200 samples were analyzed. Error bars represent standard error of the mean. (c) The number of significantly predicted genes in two independent test cohorts, obtained by using pre-trained models on the corresponding TCGA cohorts. (d) Pathway enrichment analysis on the significantly predicted genes. Each row represents a different cancer hallmark and each column a different cohort (the two right columns correspond to the two external cohorts). Values denote the multiple hypothesis corrected p-value for pathway enrichment among the genes significantly predicted by DeepPT.

