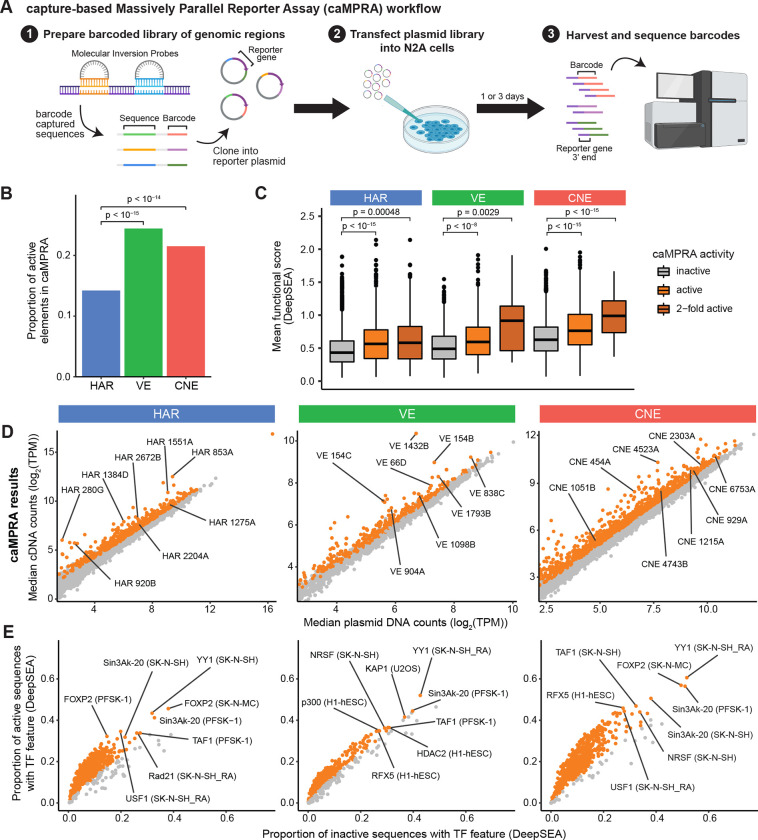
Figure 2: HARs, VEs, and CNEs display enhancer activity in a capture-based Massively Parallel Reporter Assay (caMPRA).
(A) Schematic of caMPRA method. Sequences of interest are captured by molecular inversion probes (MIPs), barcoded, and cloned upstream of a minimal promoter driving luciferase expression. ~500bp sequences are captured by separate MIP probes per HAR, VE, or CNE element. The enhancer reporter plasmid library is then transfected into N2A cells and cells are harvested one (D1) or three (D3) days after transfection. Transcribed barcodes and barcodes from the original plasmid library are sequenced to examine enhancer activity. The results from the D3 caMPRA experiment are shown in this figure, and the results from the D1 caMPRA experiment are shown in Fig. S6. (B) Proportion of VEs or CNEs that have enhancer activity in at least one captured sequence is significantly higher than HARs by the chi-square test after FDR correction. (C) Sequences captured from HARs, VEs, and CNEs are classified as inactive, active, or 2-fold active and compared to their predicted mean functional score from DeepSEA (average of −log10(e−value) for every feature) (Zhou and Troyanskaya, 2015). P-values were determined with the hypergeometric test and adjusted by FDR correction. (D) Normalized cDNA counts vs normalized plasmid counts for sequences captured from HARs, VEs, and CNEs. Sequences with significant enhancer activity are in orange. (E) TF features were predicted by DeepSEA for each captured sequence. TF features significantly enriched in active sequences by caMPRA are shown in orange. Representative TF features are marked in the format: TF (cell type).

