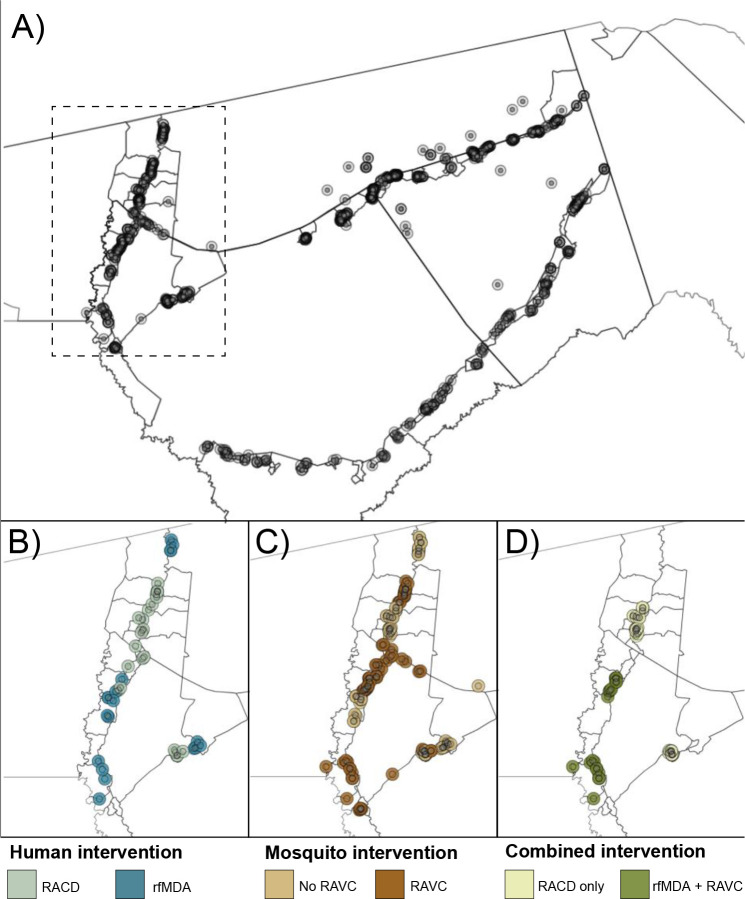
Figure 1. Map of target areas and spillover zones in the study site.
a) All index cases during the study period. The centroid of each circle is the residence location of a treated index case. Inner circles indicate 500m target areas where interventions were delivered. Outer circles indicate the 1km radius around each index case in which spillover effects were estimated in primary analyses. The dashed line indicates insets in panels B-D showing index cases during the follow-up periods with the largest number of treated index cases. For each comparison of study arms, panels b-d depict examples of analytic cohorts from a single follow-up period (i.e., subsample of person-time) in a subset of the study area. b) Inset of study area with index cases in the RACD and rfMDA arms (5-week period: April 25, 2017 – May 30, 2017). C) Inset of study area with index cases in the no RAVC and RAVC arms (6-month period: January 1, 2017 - June 30, 2017). d) Inset of study area with index cases in the RAVC and rfMDA+RAVC arms (6-month period: January 1, 2017 - June 30, 2017).
RACD: reactive case detection
rfMDA: reactive focal mass drug administration
RAVC: reactive focal vector control

