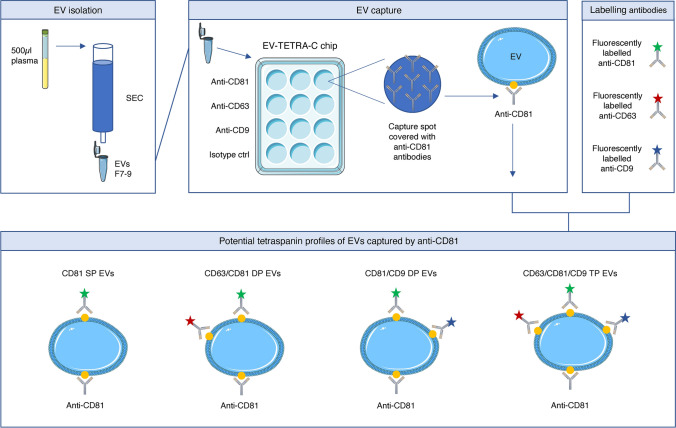
Fig. 1.
Workflow of the ExoView analysis from EV isolation to sEV profiling. EVs were isolated from plasma by size exclusion chromatography and subjected to ExoView analysis using the EV-TETRA-C chip. The lower panel shows potential tetraspanin profiles when capturing sEVs with anti-CD81, which is transferrable to sEVs captured with anti-CD63 and anti-CD9 although with some adjustments. The Figure was partly generated using Servier Medical Art, provided by Servier, licensed under a Creative Commons Attribution 3.0 unported license. *SP-single positive, DP-double positive, TP-triple positive

