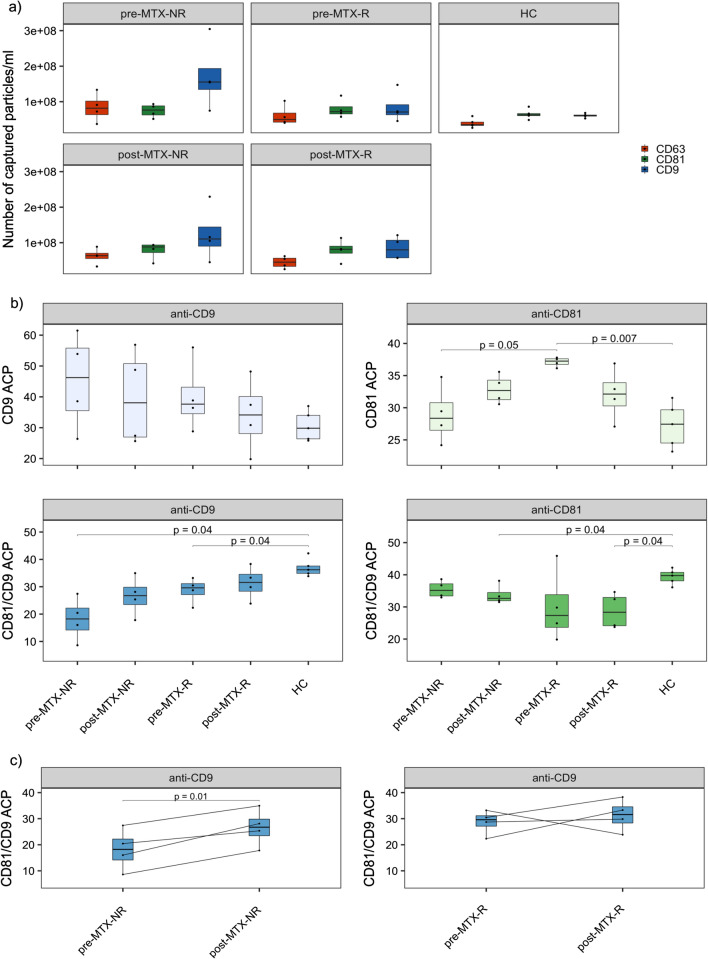
Fig. 4.
Stratified colocalization and capture analysis of RA patients and healthy controls. a number of fluorescent particles/ml captured by each capture probe in the five groups, b relative distribution of CD9 single positive sEVs, CD81 single positive sEVs, CD81/CD9 double positive sEVs captured by either anti-CD9 or anti-CD81, c paired analysis of CD81/CD9 double positive (anti-CD9 captured) sEVs in non-responders and responders pre- and post-MTX. We compared the sample mean of the groups using Welch’s two sample t-test for unequal variance. *ACP- average colocalization percent, NFP-number of fluorescent particles/ml

