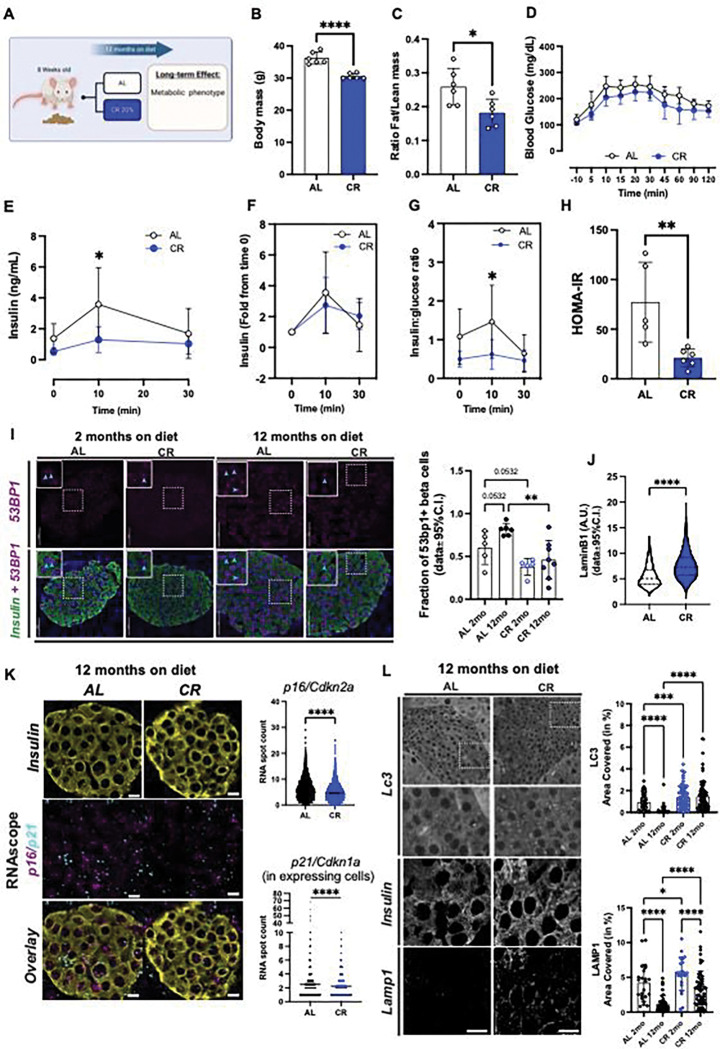
Figure 5. Long-term CR delays beta cell aging signatures.
(A) Schematic diagram of mice subjected to AL or 20% CR for 12 months starting at the age of 8 weeks. (B) Body mass after 12 months on diet. (C) Ratio between fat mass and lean mass after 12 months on diet. (D) Blood glucose levels during the meal tolerance test (MTT) after 12 months on diet. (E) Blood insulin levels during the MTT and (F) the respective fold change from baseline values. (G) Ratio between the insulin and glucose values obtained during the MTT. (H) HOMA-IR calculated from fasting glucose and insulin values after 12 months on diet. (I) Representative images of pancreatic sections from AL and CR male mice after 2 months or 12 months on diet stained with 53BP1 and insulin. Right, quantification of DNA damage by 53BP1+ beta-cells. Each dot represents the average from each mouse. A total of 127–200 islets per experimental group were analyzed. Data are normalized by percentage of 53BP1 positive beta-cells per total beta-cell number. (J) Quantification of beta cell nuclear levels of Lamin B1 in pancreatic islets from AL and CR mice after 12 months on diet. (K) Representative images of pancreatic sections from AL and CR male mice after 12 months on diet stained with Cdkn2a and Cdkn1a mRNA probes, and insulin. Right, the quantification of incidence of these markers per beta-cell. (L) Representative images of pancreatic sections from AL and CR mice after 12 months on diet stained with Lc3I-II or Lamp1. Right, quantification of beta cell area occupied by Lc3I-II or Lamp1. For all panels, data are presented as mean ± 95% confidence intervals (C.l.). The asterisks mean * p< 0.05, ** p< 0.01, *** p< 0.001 and **** p< 0.0001 using two-way ANOVA with Sídák’s multiple comparisons test or unpaired Student t-test (B, C, H, J, K). In (B-I), n=6 male mice per diet group.

