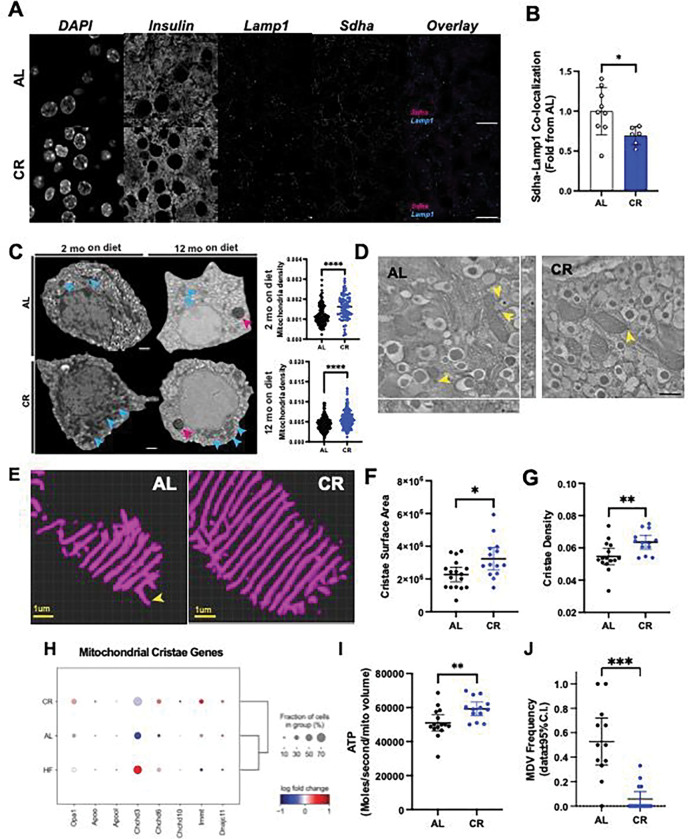
Figure 6. CR increases beta cell mitochondria density and modifies cristae structure.
(A) Representative imagens of pancreatic sections from AL and CR male mice after 2 months on diet. Slides were stained with Insulin, Lamp1 and Sdha. (B) Co-localization between Sdha and Lamp1 was measured. Each dot represents the average co-localization index in each animal calculated from approximately 100 beta cells per animal. (C) Representative images of pancreatic beta-cells from AL and CR male mice using electronic microscopy. Blue arrows point to mitochondria density, while pink arrows point to lipofuscin granules in aged beta cells. Mitochondrial density measured by the total mitochondrial number per beta cell area. Each dot represents a single beta cell analyzed from three different islets per mouse (n=3 mice per diet group). (D) Representative images of pancreatic beta cells from AL and CR male mice using high resolution electron tomography (eTomo). (E) Representative 3D reconstructions of beta cell crista segmentation generated using deep learning image analysis tools. (F-G) Cristae surface area and cristae density in AL or CR beta cells. (H) Dot plot showing the relative expression levels of genes involved in cristae formation and morphology. (I) Calculation of ATP generation for an average beta cell mitochondrion. Each dot represents data from one eTomo image stack. (J) Relative frequency of mitochondrial-derived vesicles observed in eTomo images. In (F-H and I-J), each dot represents an individual field of view with an average of 5 mitochondria per field. eTomo data acquired from n=3 mice per diet group, 5 fields of view per animal. Total of 69–70 mitochondria analyzed per diet group. The asterisks indicate * p< 0.05, ** p< 0.01, *** p< 0.001 and **** p< 0.0001 using unpaired Student t-test. In (D), scale bar = 500nm, and yellow arrowheads indicating the location of MDVs, whereas the asterisk in each image marks the location of a lysosome.

