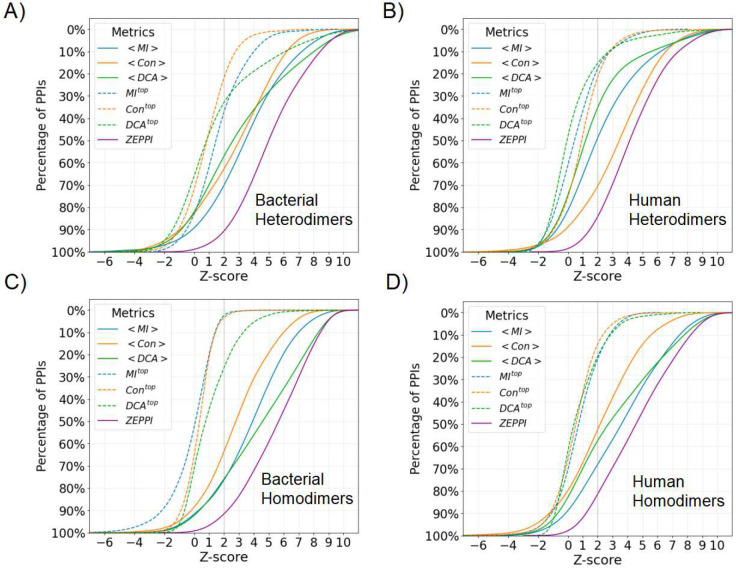
Figure 2. Percentage of PDB PPIs as a function of Z-score.
Colors and line types in the legend indicate curves for different metrics each of which corresponds to the maximum of the raw and APC values for a given PPI. The mean and top metric of all interface contacts are denoted as <>, and top, respectively. The ZEPPI score for a given PPI is the largest Z-score among all metrics and the curve for all PPIs is shown in purple. See Supplementary File 1.

