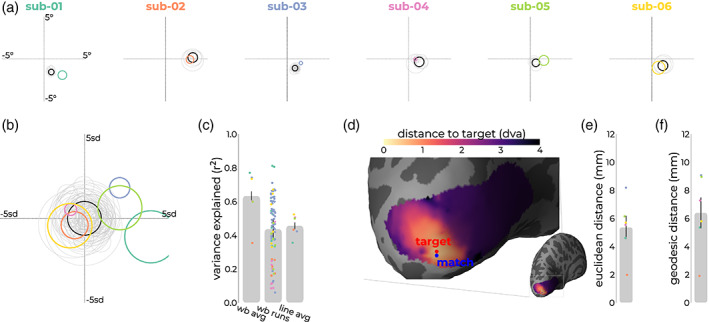
FIGURE 5.

Overview of functional confirmation metrics. (a) For all subjects, the target vertex averaged across runs (black) and individual runs (gray) from the first session, and the estimated pRF of the second (line‐scanning) averaged across runs, within‐run iterations, and gray matter voxels around target location. (b) Shows a normalized version of (a), in which line‐scanning pRFs shifted relative to the target vertex' pRF, and their sizes are divided by the target vertex' pRF size (standard devation [sd]). (c) Variance explained for the target vertex averaged across runs (wb avg), individual runs (wb runs), and line‐scanning data (line avg). (d) For each vertex in V1, we assessed the distance from the vertices' pRF to the line‐scanning pRF in visual space. pRFs closer to the line are represented by lighter colors, while pRFs farther away show up in darker colors. We then assessed where in V1 the pRF from the whole‐brain data (blue) matched best with the target vertex (red) in terms of Euclidean (e) and geodesic (f) distance. pRF, population receptive field.
