
FIGURE 6.
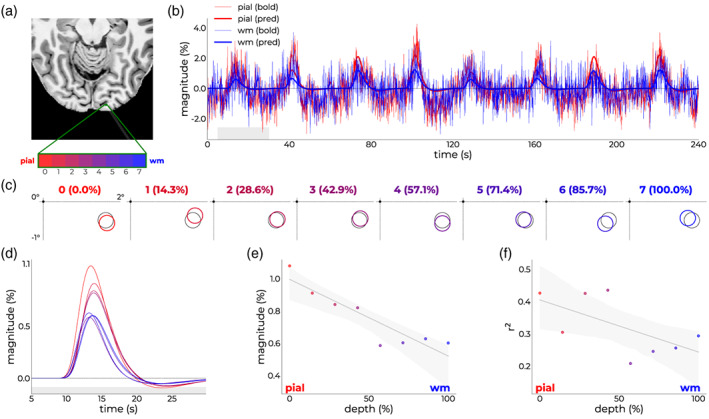
Single‐subject depth‐dependent outcomes. (a) Axial slice from T1‐image with the imaged line in white shading. Independent voxels covering the cortical ribbon are annotated in green and assigned a color ranging from red (superficial) to blue (deep). (b) Raw time courses (thin lines) and model predictions (thick lines) for a superficial (red) and deep (blue) voxel. (c) Position estimates in the bottom right quadrant of the visual field from voxels covering the cortical ribbon in color that scales from red (0% depth—superficial) to blue (100% depth—deep). Note that all time courses were modeled independently. (d) Response profile of the first bar pass across depth (same color coding as c); inset shows the magnitude. (e) Magnitude and (f) variance explained as a function of depth.