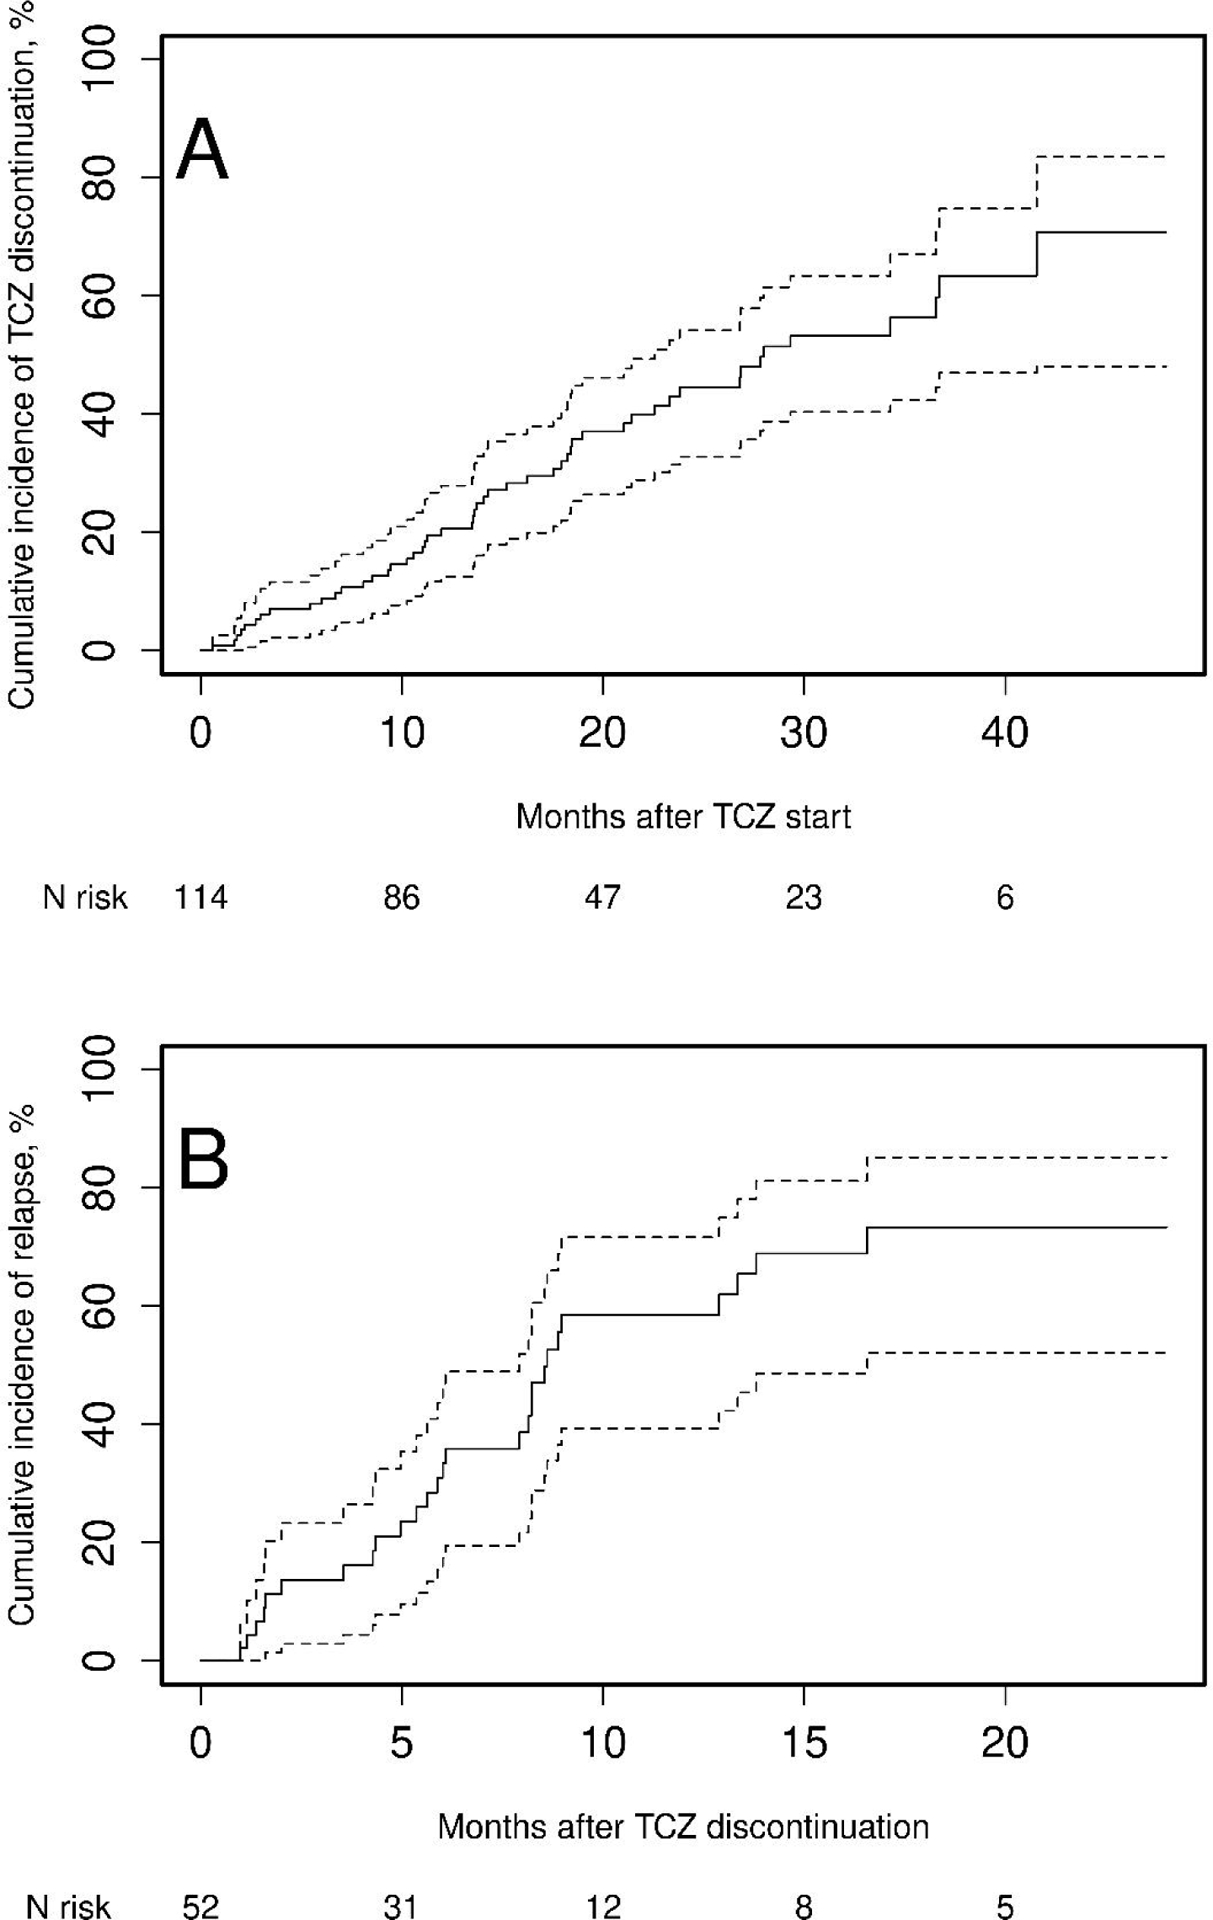
Figure 1.

Kaplan-Meier curve of time from tocilizumab start to tocilizumab discontinuation (panel A) and time from tocilizumab discontinuation to first relapse after tocilizumab discontinuation (panel B). The solid line on each panel is the estimated cumulative incidence of the event and the dashed lines are the 95% confidence intervals.
