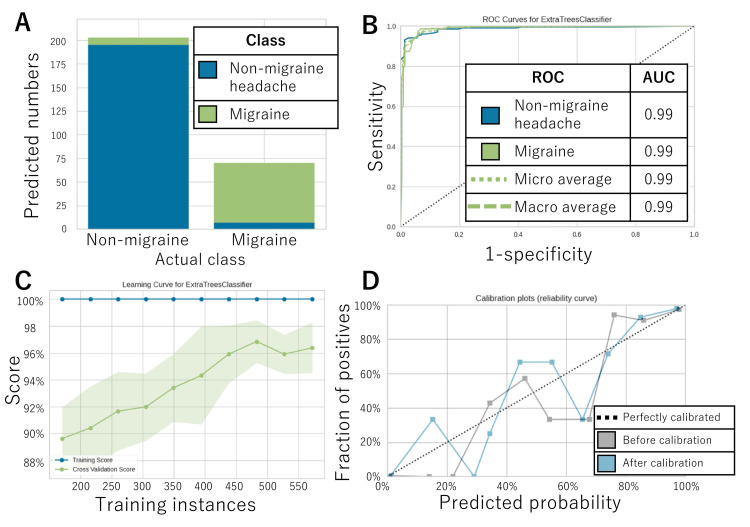
Figure 2. AI model’s performance.
The performance of the AI model for the test data is illustrated in A. The ROC curve for each class and its AUC are shown in B. The learning curve and calibration curve are shown in C and D, respectively.
AI, artificial intelligence; AUC, area under the curve; ROC, receiver operating characteristic

