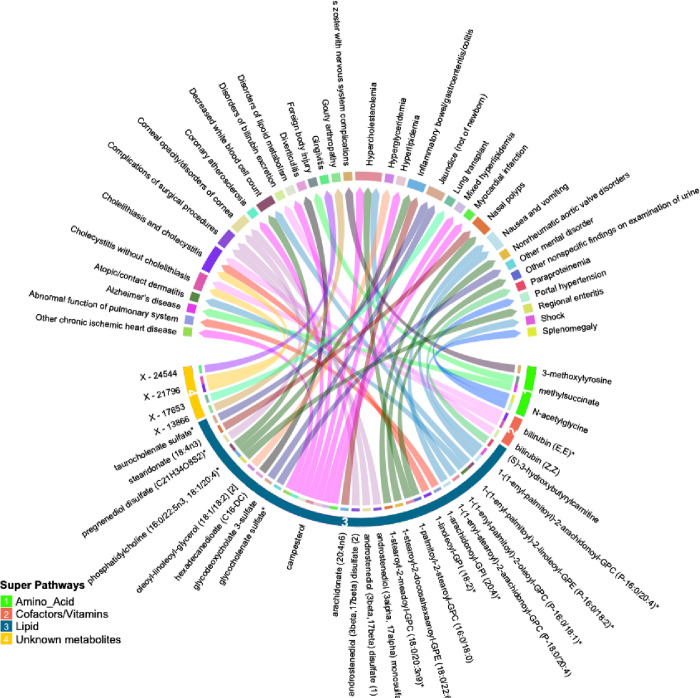
Figure 2.
Circular plot summarizing significant associations between circulating metabolites and phenotypes identified by inverse-variance weighted association (IVWA) Mendelian randomization (FDR p<0.05). Metabolites are shown in bottom half of the figure with super-pathways depicted on the outer track (with colors and numbers) and sub-pathways shown as the color of each line (i.e. lines with the same color belong to the same sub pathway). Each color of the outer top track and the inner bottom track corresponds to a specific phenotype.

