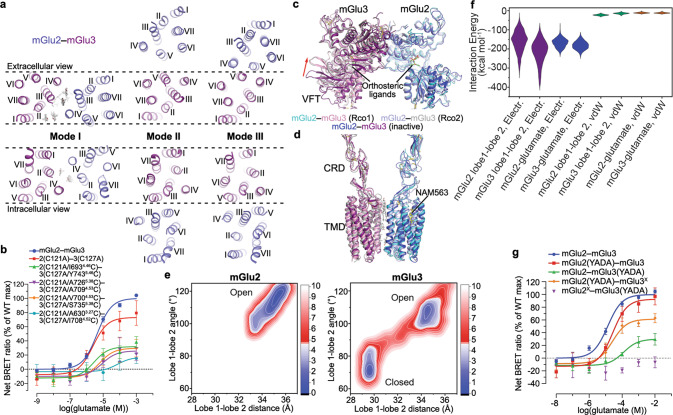
Fig. 2. Inactive dimerization modes and Rco conformations of mGlu2–mGlu3.
a Comparison of the dimerization modes in the inactive mGlu2–mGlu3. The TMDs of the inactive mGlu2–mGlu3 in dimerization modes I, II, and III are shown in both extracellular (top) and intracellular (bottom) views. The mGlu2 and mGlu3 subunits are colored blue and purple, respectively. The lipids in dimerization mode I are shown as gray sticks. The dashed lines indicate that the mGlu3 subunits in the structures are in the same orientation. b, g Glutamate-induced Gi activation of the wild type and mutants of mGlu2–mGlu3 measured by the BRET assay. The BRET data are means ± SEM from at least three independent experiments performed in duplicate. Supplementary information, Table S2 provides detailed independent experiment numbers (n), statistical evaluation, and protein expression levels. c, d Comparison between the Rco conformations and the inactive conformation in dimerization mode I. The Rco structures of mGlu2–mGlu3 in the presence of NAM563 (Rco1) or glutamate, JNJ-40411813, and CaCl2 (Rco2) and the inactive structure of mGlu2–mGlu3 in the presence of LY341495, NAM563, and LY2389575 in dimerization mode I are shown at the VFTs (c) and the CRDs and TMDs (d). The red arrow in c indicates the open-to-closed conformational change of the mGlu3 VFT in the Rco structures relative to the inactive structure. The ligands bound in these structures are shown as sticks. e 2D free energy landscapes (FELs) spanned by the distance between the centroids of the two lobes and the lobe 1–lobe 2 subdomain angle of mGlu2 and mGlu3. The contours in the 2D subspace are spaced at intervals of 1.0 kcal/mol. f The ranges of various interaction energies in the open state, including the electrostatic interaction energies between the lobe 1 and lobe 2 subdomains of mGlu2 and mGlu3 (purple), and between the glutamate molecule and mGlu2 or mGlu3 (blue), as well as the vdW energies between the lobe 1 and lobe 2 subdomains of mGlu2 and mGlu3 (green), and between the glutamate molecule and mGlu2 or mGlu3 (brown), respectively.

