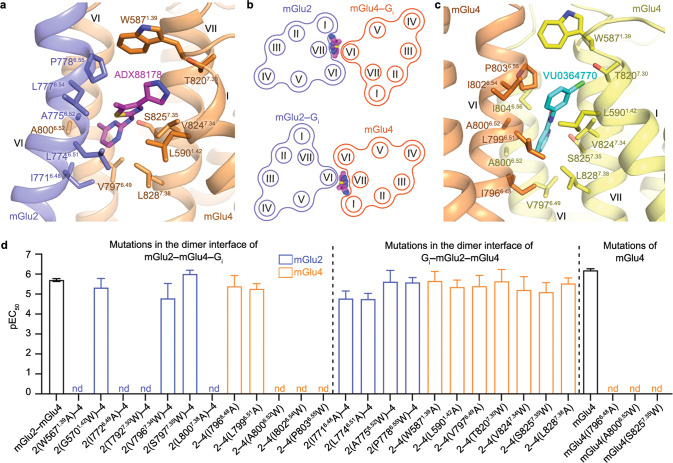
Fig. 4. PAM binding modes.
a Binding mode of ADX88178 in the mGlu2–mGlu4 heterodimer. The Gi-bound structure of mGlu2–mGlu4 is shown in cartoon representation, with mGlu2 and mGlu4 colored blue and orange, respectively. The PAM ADX88178 is shown as magenta sticks. The residues in the two subunits that interact with ADX88178 are shown as sticks. b Schematic diagrams showing that ADX88178 can bind to the dimer interface in mGlu2–mGlu4 when either of the subunits couples to the G protein. Top, mGlu2–mGlu4–Gi; bottom, Gi–mGlu2–mGlu4. c Binding mode of VU0364770 in the mGlu4 homodimer. The mGlu4–Gi3 structure is shown in cartoon representation, with the G protein-bound subunit and the G protein-free subunit colored orange and yellow, respectively. The PAM VU0364770 is shown as cyan sticks. d ADX88178-induced Gi activation of mGlu2–mGlu4 heterodimer and mGlu4 homodimer. Bars represent calculated PAM potency (pEC50), and are colored according to locations of the mutations. See Supplementary information, Table S2 for values of Emax. The mGlu2–mGlu4 mutations are divided into two groups, one including the mutations in the potential dimer interface of the mGlu2–mGlu4–Gi complex and the other including the mutations in the dimer interface of the Gi–mGlu2–mGlu4 complex. Data are means ± SEM from at least three independent experiments performed in duplicate. Supplementary information, Table S2 provides detailed independent experiment numbers (n), statistical evaluation, and protein expression levels.

