
Figure 1.
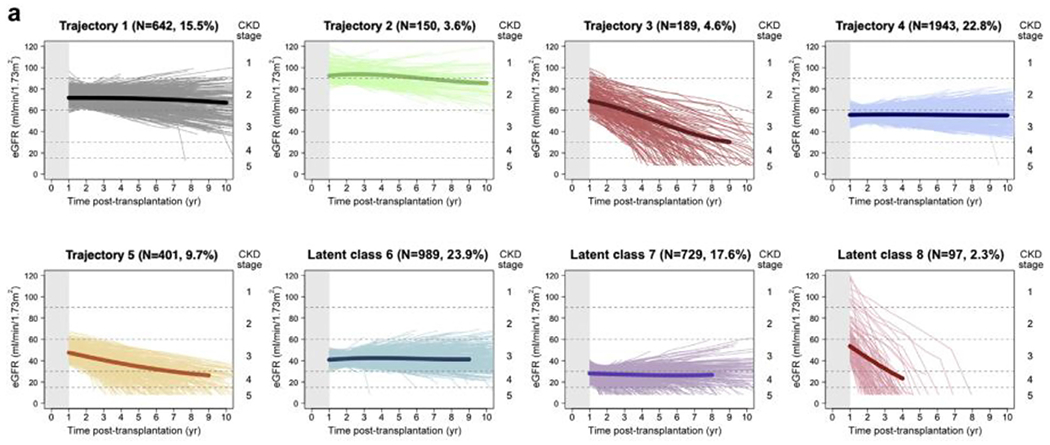
Trajectory of glomerular filtration rate after kidney transplantation. The main profiles of kidney function identified using latent class mixed models. Estimated glomerular filtration rate (eGFR) trajectory 1: patients with high baseline renal function (~70 mL/min per 1.73 m2) that remained stable; eGFR trajectory 2: patients with very high baseline kidney function (~90 mL/min per 1.73 m2) with slightly decreasing function over time; eGFR trajectory 3: patients with high baseline kidney function (~70 mL/min per 1.73 m2) and fast decline over time; eGFR trajectory 4: a pattern of intermediate baseline eGFR (~55 mL/min per 1.73 m2) and stability over time; eGFR trajectory 5: intermediate/low baseline eGFR (48 mL/min per 1.73 m2) with decreasing function over time; eGFR trajectory 6: patients with low baseline eGFR (~40 mL/min per 1.73 m2) with stability over time; eGFR trajectory 7: patients with very low baseline eGFR (28 mL/min per 1.73 m2) and mildly declining function over time; and eGFR trajectory 8: patients with intermediate eGFR (58 mL/min per 1.73 m2) but a very fast subsequent decline in eGFR trajectory. Abbreviation: CKD, chronic kidney disease. Recreated with permission from Raynaud et al.5