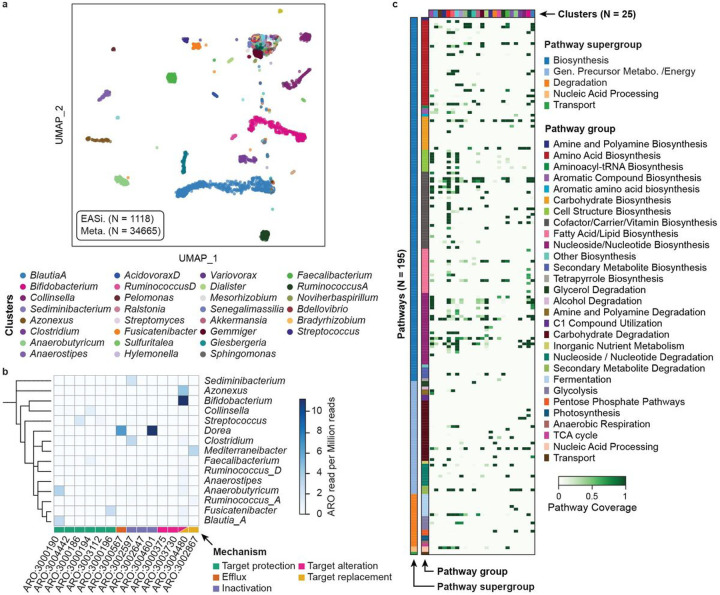
Figure 4. Human gut microbiome genome atlas.
a) Integrated UMAP clustering of the single cell barcodes and metagenomic assembled contigs of a human microbiome sample. Each barcode/contig was annotated based on the most abundant genus. Only the top 30 clusters are labeled in the legend.
b) Antibiotic resistance gene distribution in the clusters identified by TDA. Rows represented annotated genus and columns represent resistance gene access numbers from the Comprehensive Antibiotic Resistance Database. The value represents the read counts of the corresponding antibiotic resistance gene per million combined reads of each cluster.
c) Relative pathway abundance in the identified clusters. All reads in EASi-seq barcode groups associated to each cluster were combined and analyzed using MetaPhlAn and the MetaCyc database. The relative abundances of each pathway (copy per million, CPMs) were normalized to the barcode counts in each cluster. Clusters are color coded to the genera listed in (a).

