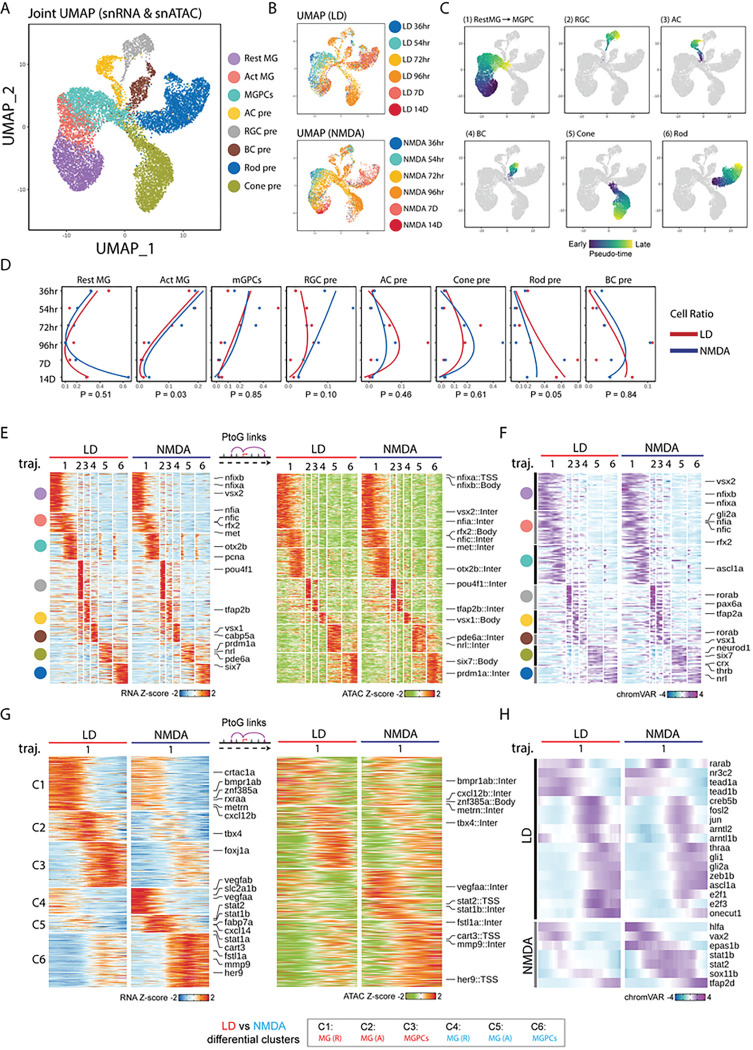
Figure 2: Shared and differential patterns of gene expression and chromatin accessibility data observed in MG-derived cells following LD and NMDA treatment.
(A,B) Combined UMAP projection of MG and progenitor neuron cells profiled using multiomic sequencing. Each point (cell) is colored by cell type (A) and time points (B).
(C) UMAPs showing trajectories constructed from mutiomics datasets of combined LD and NMDA datasets. Color indicates pseudotime state.
(D) Line graphs showing the fraction of cells (x axis) at each time point (y axis) of each cell type. Lines are colored by treatment.
(E) Heatmap shows the consensus marker genes and their related marker peaks (TSS and enhancer) between LD and NMDA treatment for each cell type.
(F) Heatmap shows the consensus motifs between LD and NMDA treatment for each cell type.
(G) Heatmap shows the differential genes and their related differential peaks (TSS and enhancer) between LD and NMDA treatment for MG(R), MG(A) and MGPCs.
(H) Heatmap shows the differential motifs between LD and NMDA treatment for MG(R), MG(A), and MGPCs.

