
Figure 6: Transcription factors controlling differential expression genes in MGPC in injured retina and progenitor cells in developing retina.
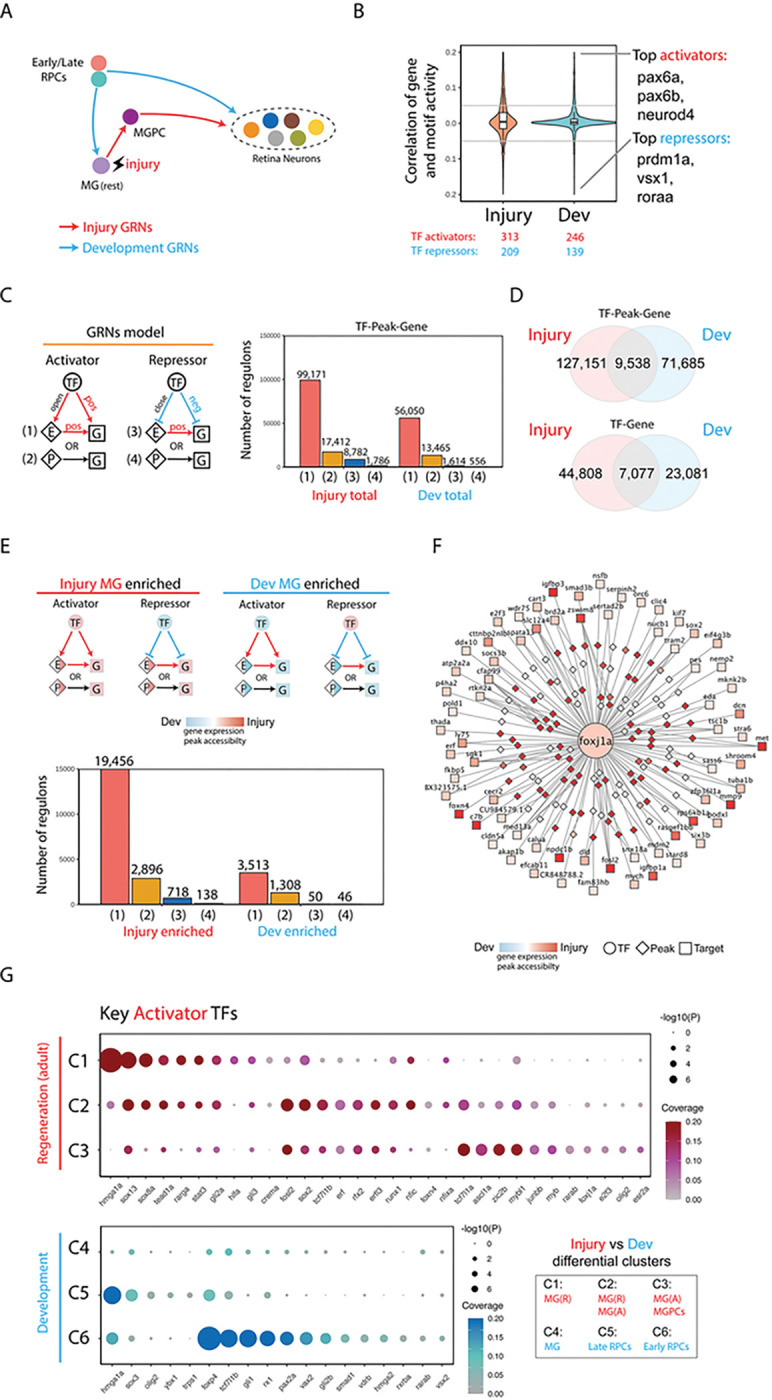
(A) Schematic of MG regeneration between injury and development.
(B) Inference of activator and repressor function for each individual transcription factor from mulitomic datasets. The y-axis represents the correlation distribution between gene expression and chromVAR score. The top three activator and repressor TFs are shown on the right.
(C) Gene regulatory networks of injury and development datasets. (left) Triple regulons model. (right) barplot shows the number of types of regulons.
(D) Venn diagram shows the overlap of regulons between injury and development GRNs.
(E) Enriched gene regulatory networks of injury and development. (Left) Enriched Triple regulons model for each condition. (Right) barplot shows the number of different types of regulons between injury and development enriched GRNs.
(F) An example of foxj1a regulons. Color indicates the log2 fold change between injury and developmental datasets.
(G) Dotplot showing key activator TFs for each divergent gene cluster. The size of the dot showing the gene ratio and color indicates the significance of regulation.