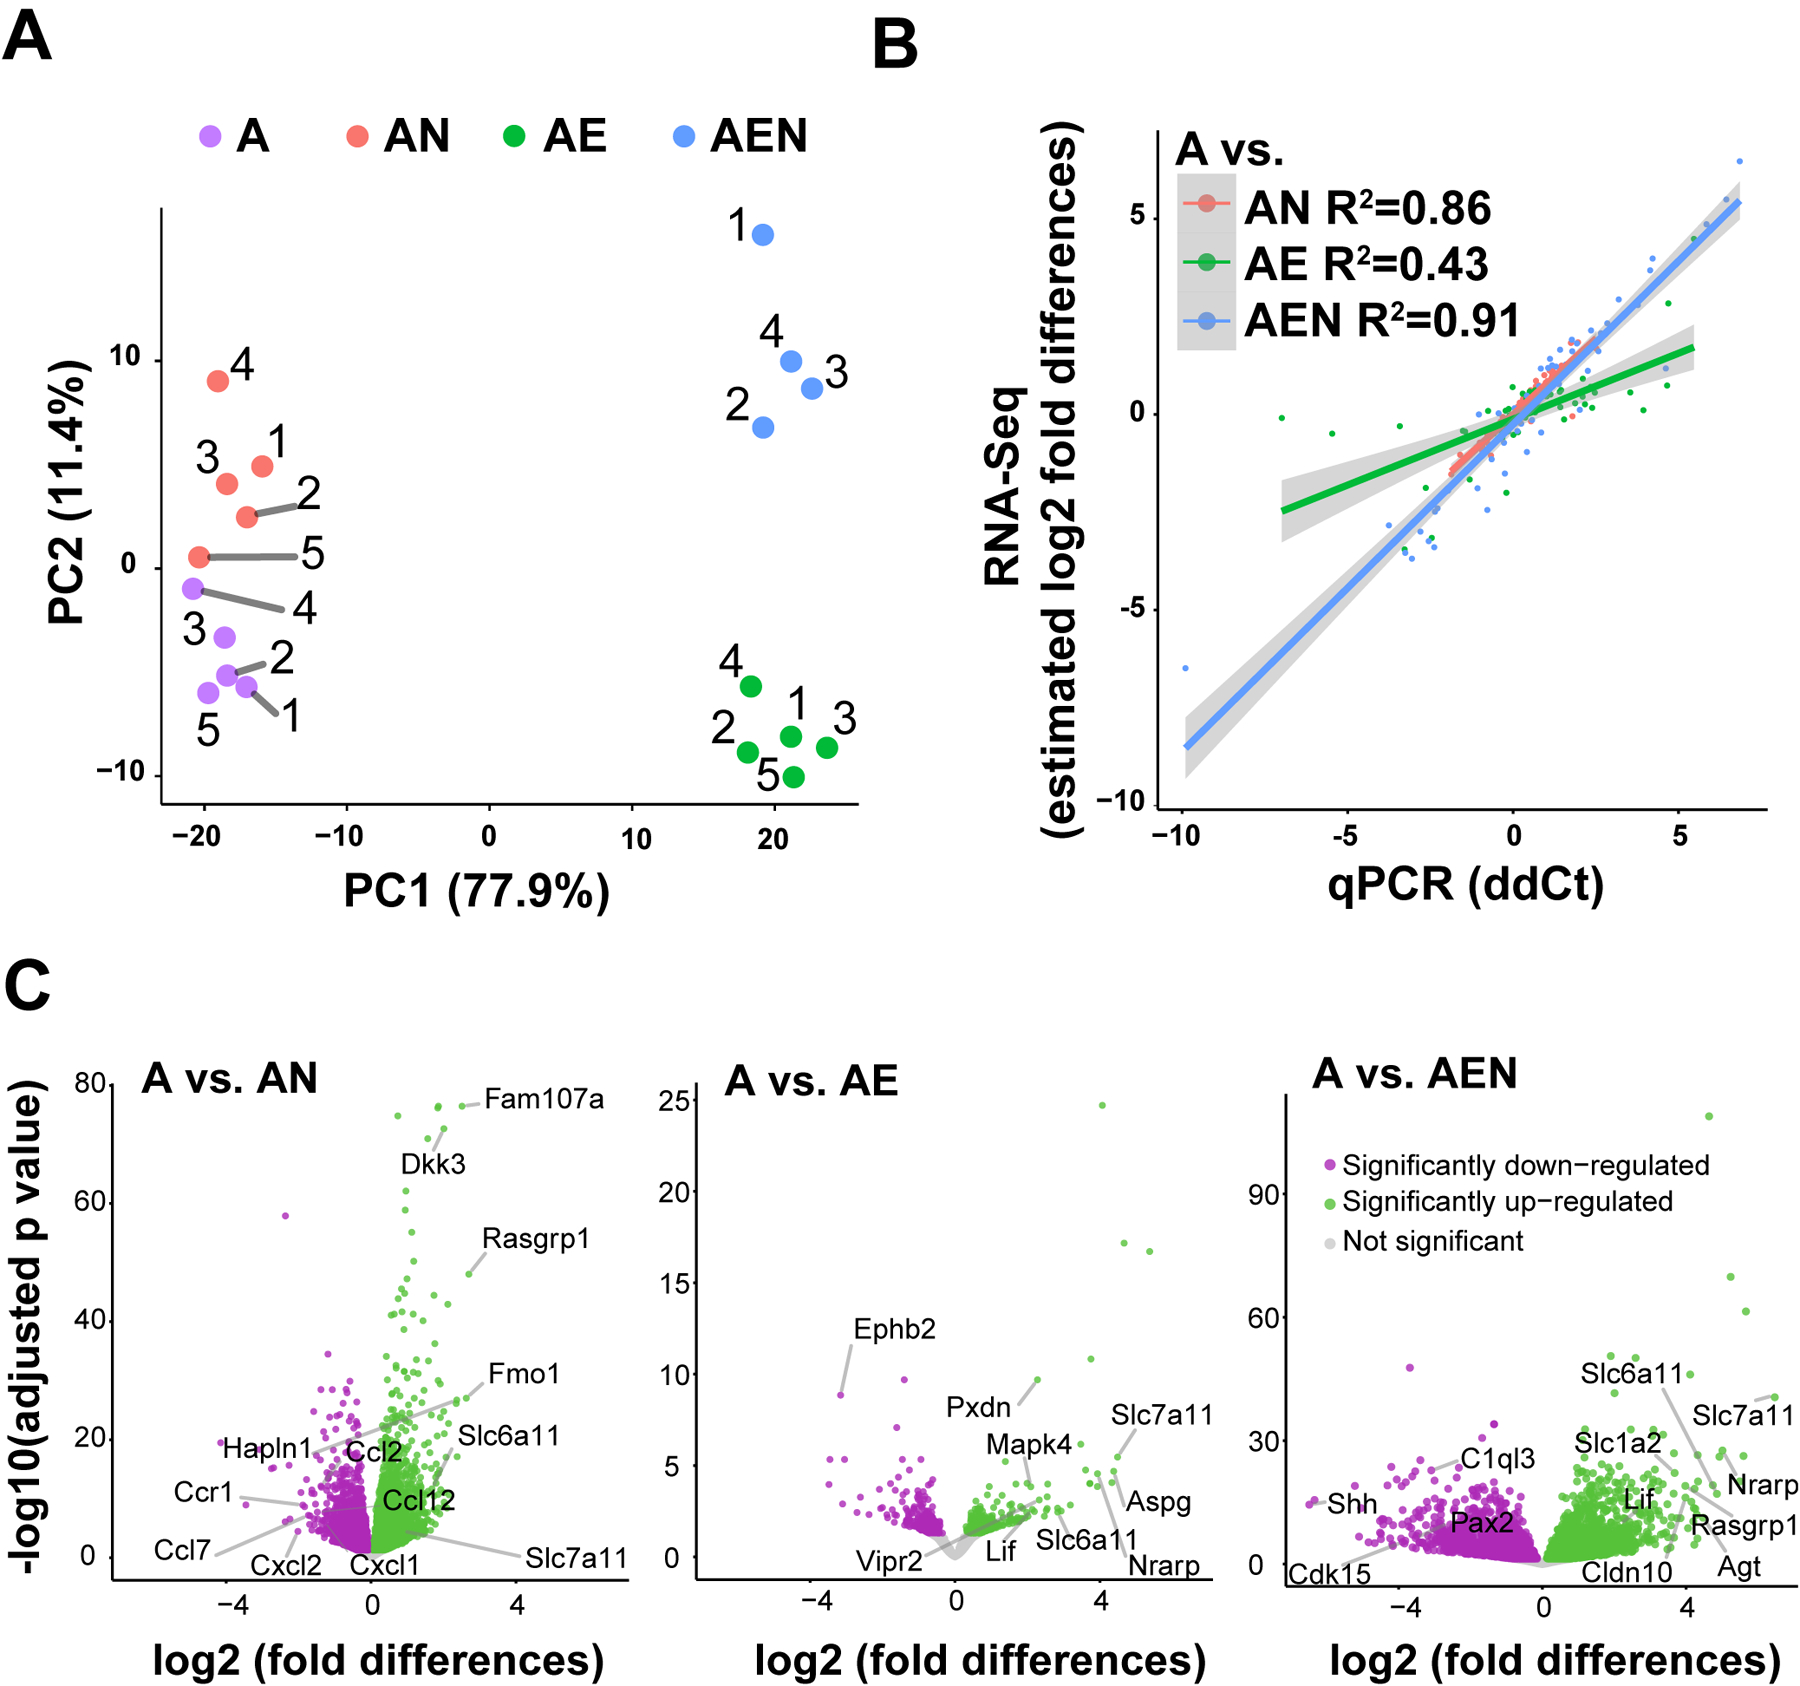
Figure 2. Co-culture configurations modify the transcriptome of astrocytes.

A. Principal component analysis of RNAseq data shows that samples cluster based on culture configurations, that the main driver of clustering is the presence/absence of endothelial cells, and the low variance between our independent biological replicates. B. Quantitative PCR was performed using microfluidics to validate the RNAseq. The average between Hars2, Srbd1, and Srp68 was used as normalized control due to their low variance between culture configurations. The ddCt method was used to calculate relative gene expression. See complete data set and description of statistics in Table 3. ddCt (x-axis) was compared to estimated log2-fold differences calculated by DESeq2 (y-axis). C. Volcano plots show all genes identified and highlight differentially expressed genes (DEG) in astrocyte monocultures (A) compared to AN, AE, and AEN respectively. Genes differentially up- or down-regulated are shown in green and magenta respectively, the rest of the genes that were identified by sequencing but with non-significant differences between culture configurations (p>0.05) are shown in gray. Some genes mentioned in the results/discussion sections are highlighted. Solute carrier family 6 member 11 (Slc6a11, gene that encodes the GABA transporter 3 (GAT3)) and solute carrier family 7 member 11 (Slc7a11, gene that encodes the cystine/glutamate transporter) are shown as examples of genes that are modified by all co-culture configurations. Note that while the X-axis shows log2-fold differences between A and co-culture configurations using the same scale in all volcano plots, the Y-axis shows adjusted p-value on a different scale. The list with all DEG with statistical reports is found in Table S1.
