
Figure 6. GAT3, FAM107A, and GLT1 are regulated through development in the mouse somatosensory cortex.
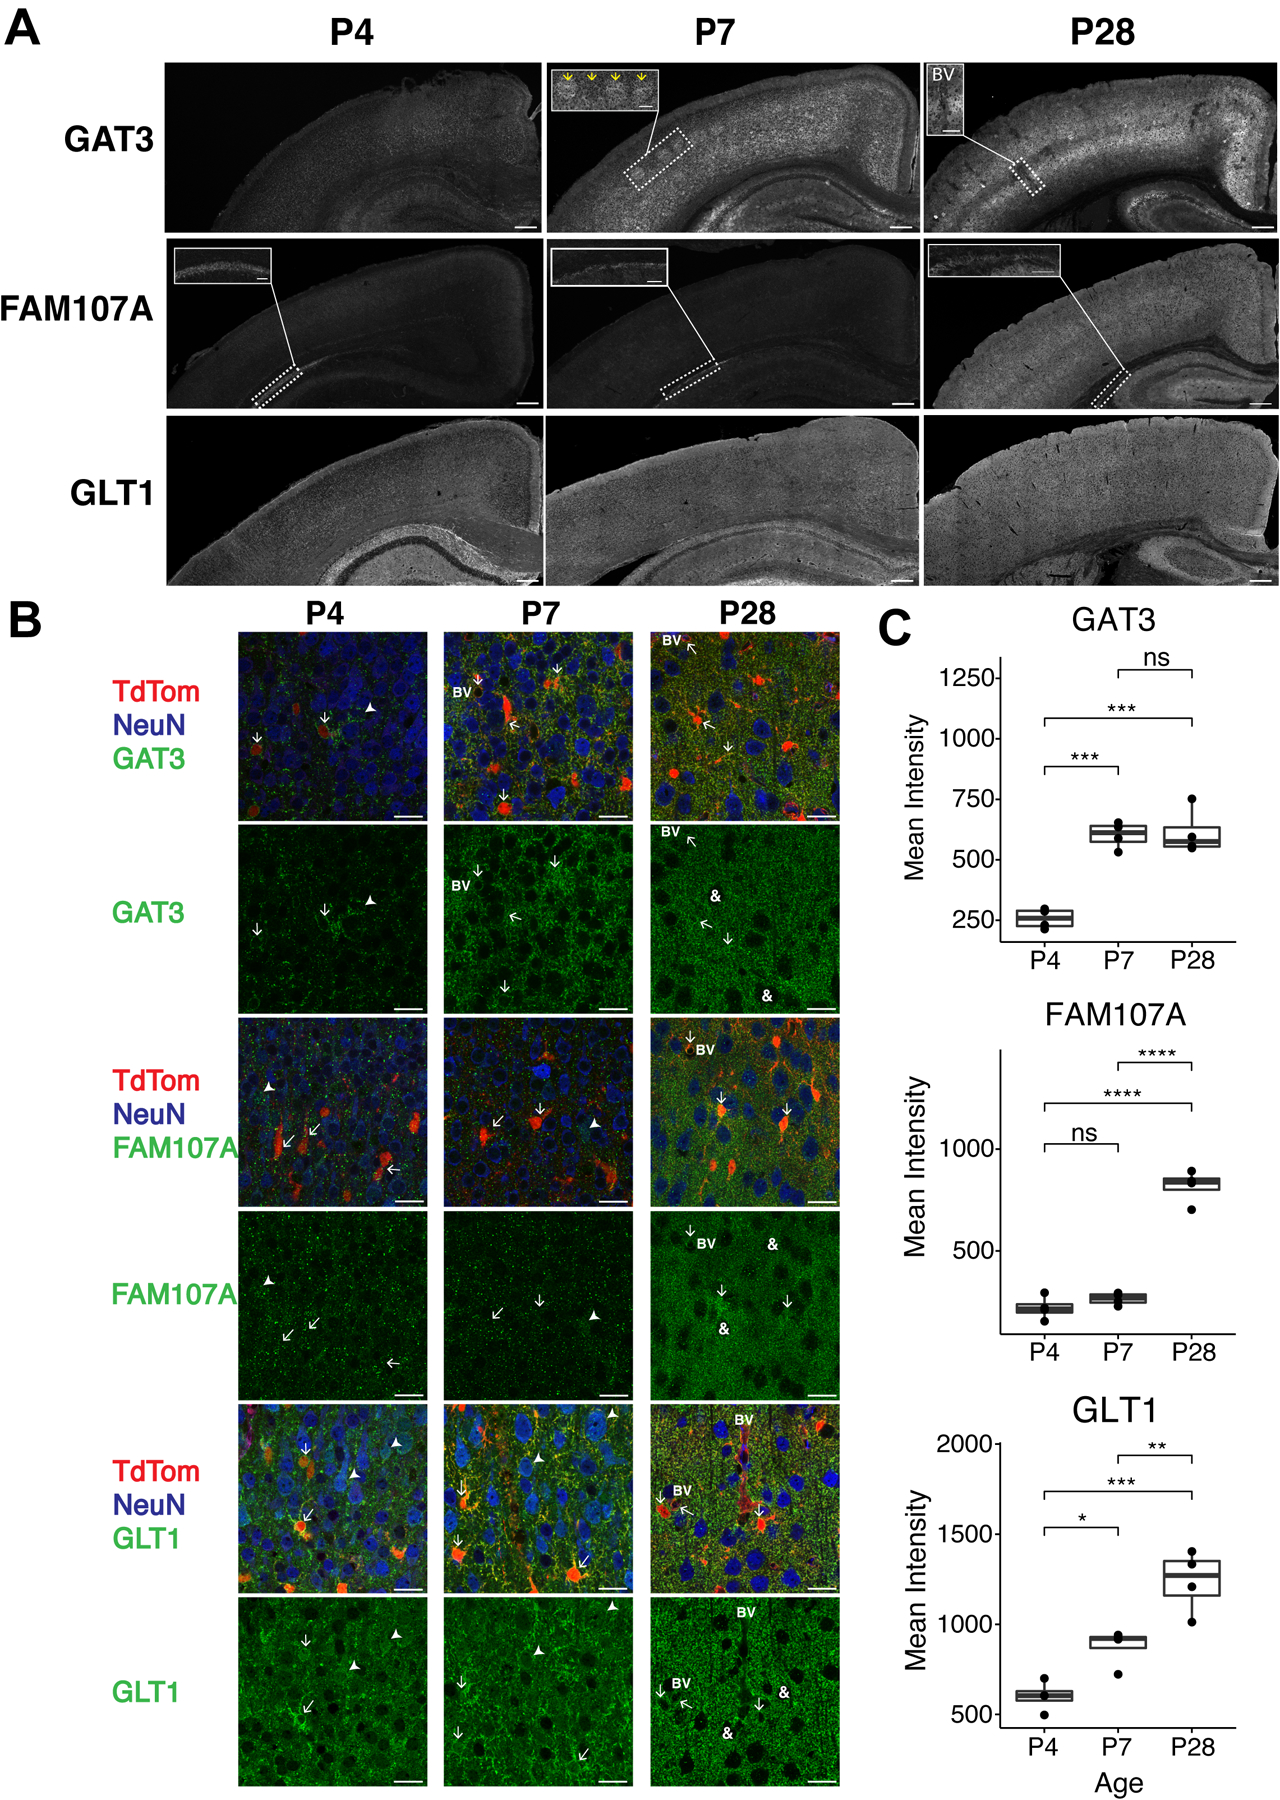
A. Mosaic images taken from P4, P7, and P28 mouse somatosensory cortex for GAT3 (encoded by Slc6a11) (top row), FAM107A (middle row), and GLT1 (encoded by Slc1a2) (bottom row). Outsets in GAT3 show presence of barrels in the barrel cortex (P7) and heterogeneity around blood vessels (P28). Outsets in FAM107A show a distinct region of the hippocampal CA1 where expression is higher. Scale bars = 250 μm and 100 μm for the outsets. Images acquired with LSM880 at 20X. B. Higher magnification images of P4, P7, and P28 mouse somatosensory cortex for GAT3 (top 2 rows), FAM107A (middle 2 rows), and GLT1 (bottom 2 rows). TdTom = tdTomato signal in astrocytes, NeuN = neuronal cell bodies, arrows = astrocytes, arrow heads = neurons, BV = blood vessel, &= highlight that neurons lack immunoreactivity for these targets, scale bars = 20 μm. Images acquired with Olympus FV1000 LSM at 60X with 1.6x optical zoom. C. Quantification of expression of GAT3 (top), FAM107A (middle), and GLT1 (bottom) in mouse somatosensory cortex at P4, P7, and P28. Graphs show data points for each individual animal. One-way ANOVA with Tukey post-hoc was performed on the mean fluorescence intensity values per visual field of each animal versus developmental time point (n = 4 per Timepoint). * p < 0.05, **p < 0.01, ***p < 0.001, ****p < 0.0001, ns = not significant.