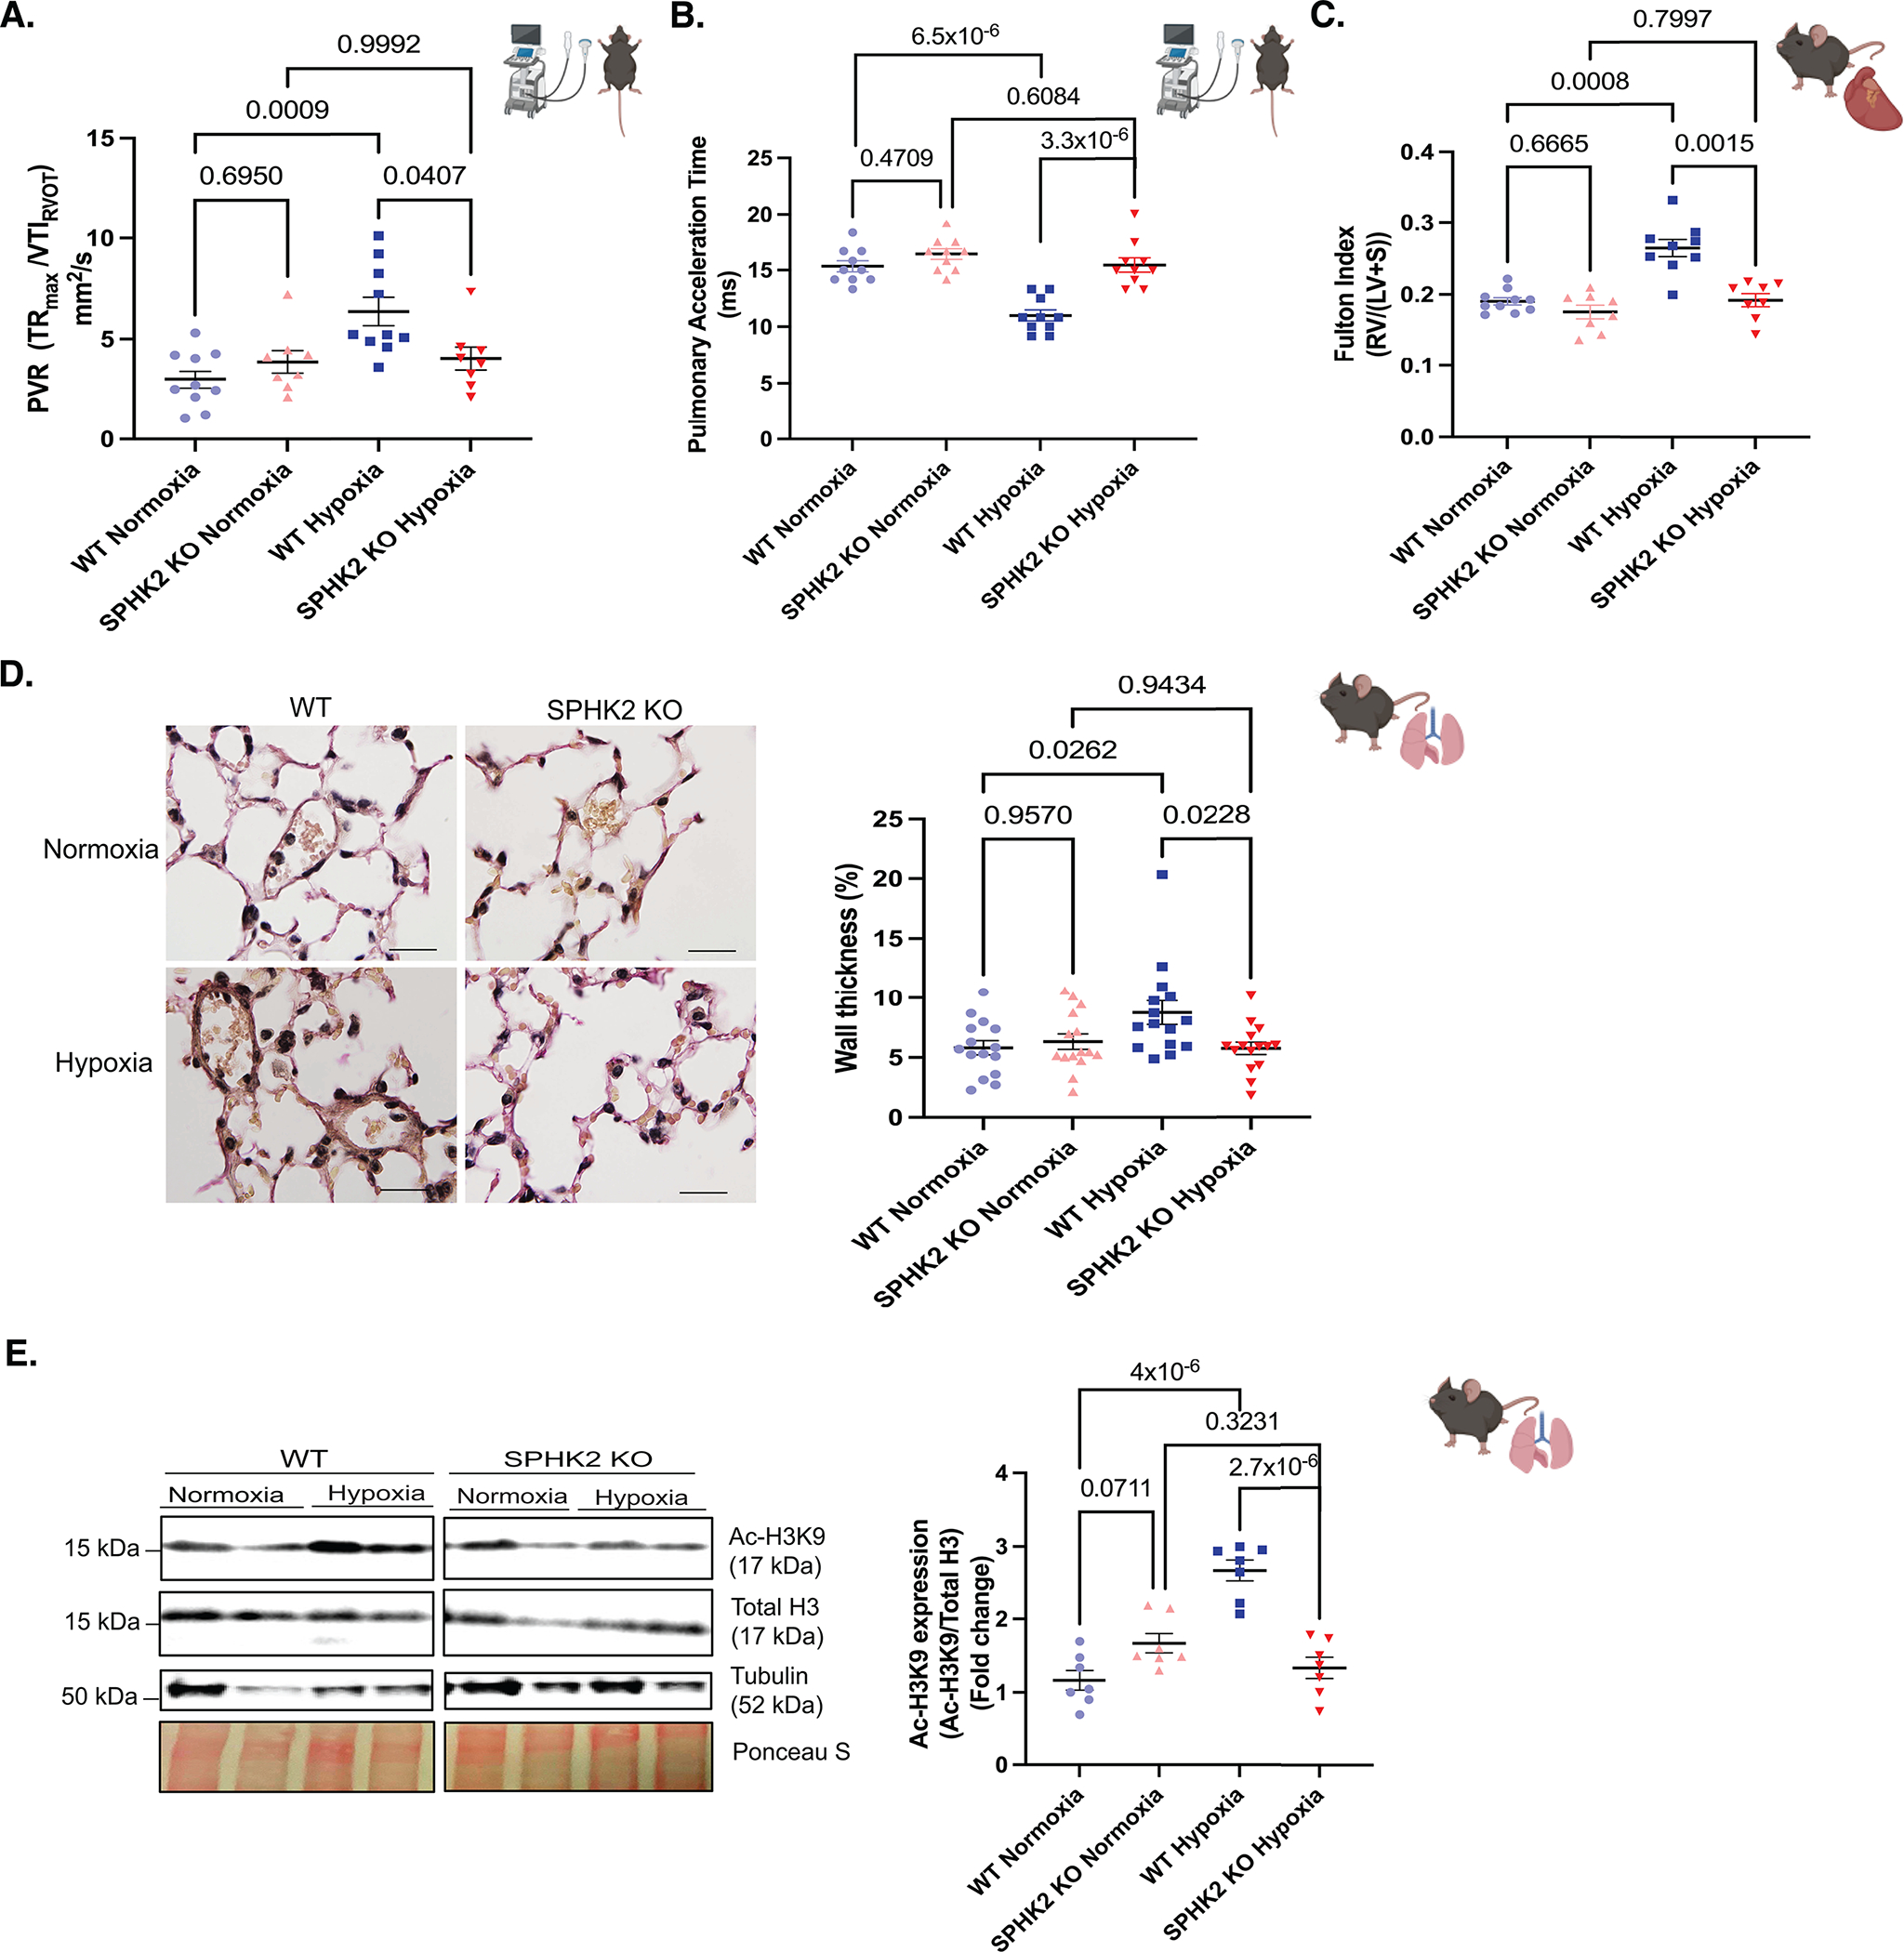
Figure 2. SPHK2 ablation confers protection against experimental PH and hyperacetylation of H3K9 in hypoxia-induced experimental PH mouse model.

SPHK2 KO or wild type (WT) control mice (C57BL/6NJ) were subjected to 3 wks of hypoxia (10% O2) or normoxia (room air). (A) Pulmonary vascular resistance (the maximum velocity of tricuspid regurgitation/the velocity time integral of the right ventricular outflow tract, TRmax velocity/VTIRVOT) n=8–10/group. (B) Pulmonary acceleration time (PAT), n=8–10/group. (C) RV hypertrophy/Fulton Index (the weight ratio of the right ventricle divided by the sum of left ventricle and septum, RV/(LV + S)) n=8–10/group. (D) Representative images of elastin-stained distal pulmonary vessels and, wall thickness of distal pulmonary vessels in elastin-stained lung tissue sections (wall thickness (%) = (2 × medial wall thickness / external diameter) × 100) n= 3/group randomly selected mice per each group and n=15 images of distal pulmonary vessels, scale bar is 10 μm, n=5–6/group. (E) Representative immunoblot probed for Ac-H3K9, total H3, Tubulin and ponceau S staining in whole tissue lysates from WT or SPHK2 KO in normoxia or hypoxia on same blot n=5–7/group and, quantitation of Ac-H3K9/Total H3. P values are calculated using one-way ANOVA following Tukey’s multiple comparisons test, and results are shown as means ± SEM.
