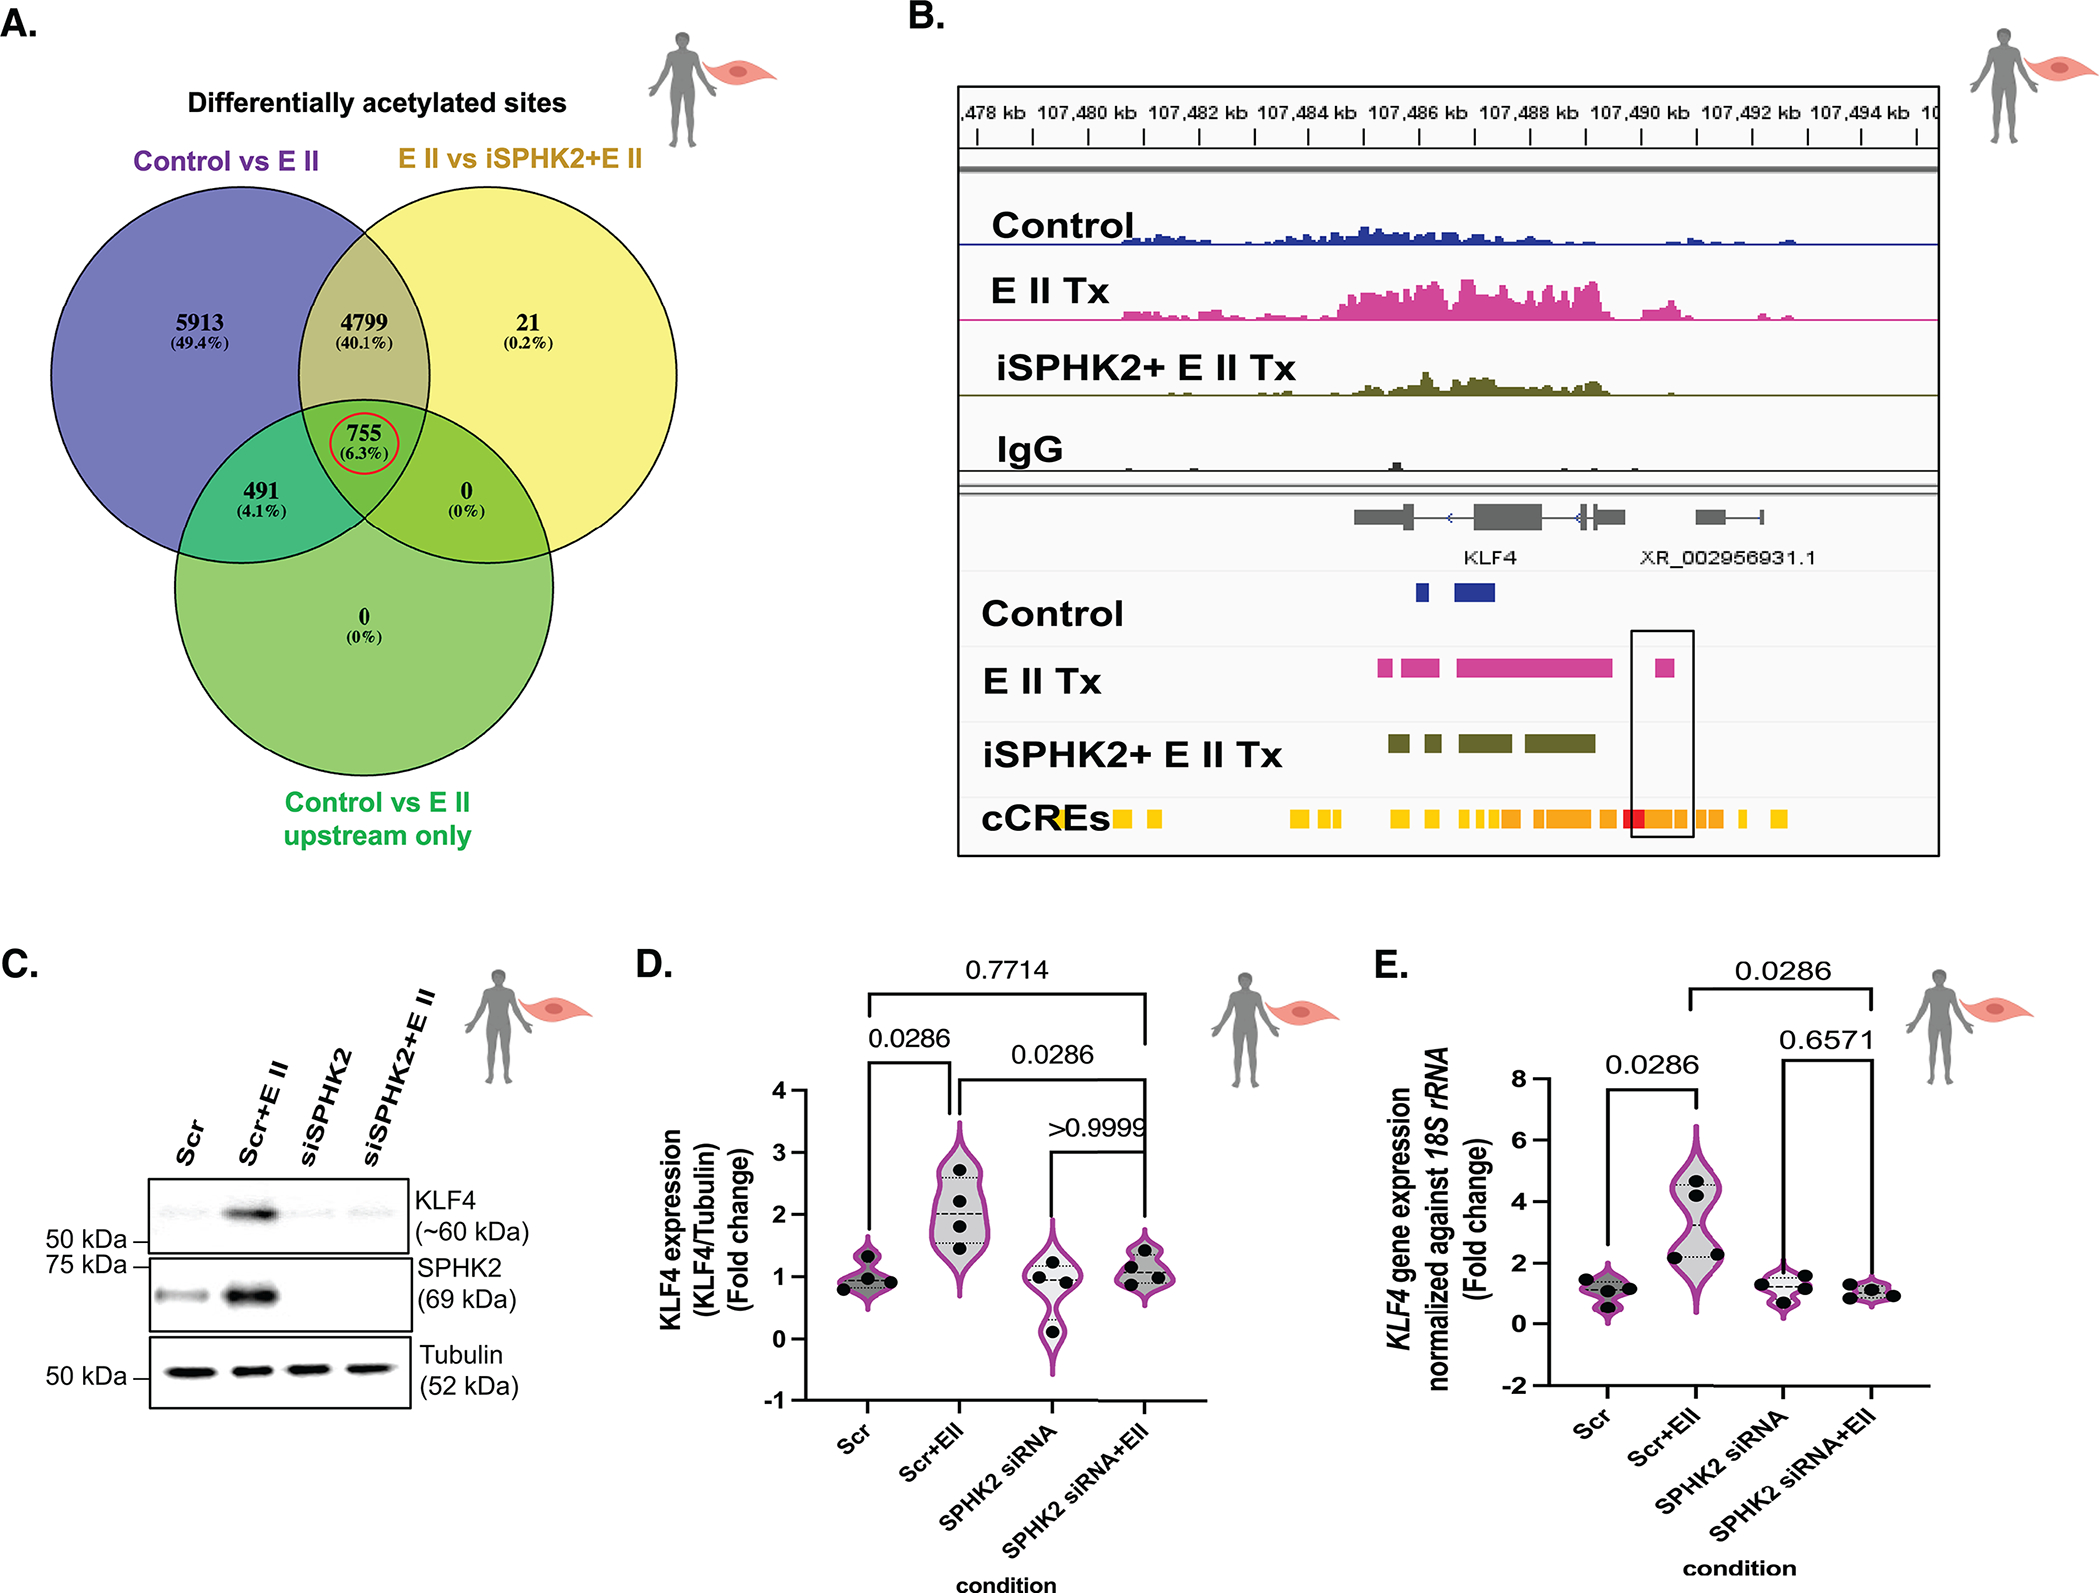
Figure 6. EMAP II mediated SPHK2 signaling promotes local hyperacetylation of histone H3K9 of KLF4 enhancers and alters the local transcription machinery of KLF4 in vascular SMCs.

(A) The Venn’s diagram of differential acetylated sites in control vs EMAP II (total) (purple), EMAP II vs iSPHK2+EMAP II (yellow) and control vs EMAPII only in 5’UTR and upstream with fold enrichment greater than 2 (green). The red circle indicates the potential gene set with potential upstream candidate regulatory elements that would be differentially acetylated by EMAP II through SPHK2 in hPASMCs. Venn diagram is created using Venny 2.1 (an online interactive tool), n=2/group (B) Snapshot of IGV view of KLF4 gene in Ac-H3K9 CUT&RUN data of with or without SPHK2 inhibitor and EMAP II treated (2–3 hours) hPASMCs. (cCRE= candidate Cis-Regulatory Elements) n=2/group (C) Representative immunoblot probed for KLF4, SPHK2 and tubulin in whole cell lysates of hPASMCs following siRNA mediated SPHK2 silencing and post-transfection EMAP II treatment for 6–8 hours, and (D) quantitation of KLF4/tubulin and (E) KLF4 expression levels normalized against 18S rRNA in hPASMC cells following siRNA mediated SPHK2 silencing and EMAP II treatment for 6 hours, n=4. P values are calculated using Kolmogorov-Smirnov non-parametric testing and results are shown as median and inter-quartile range.
