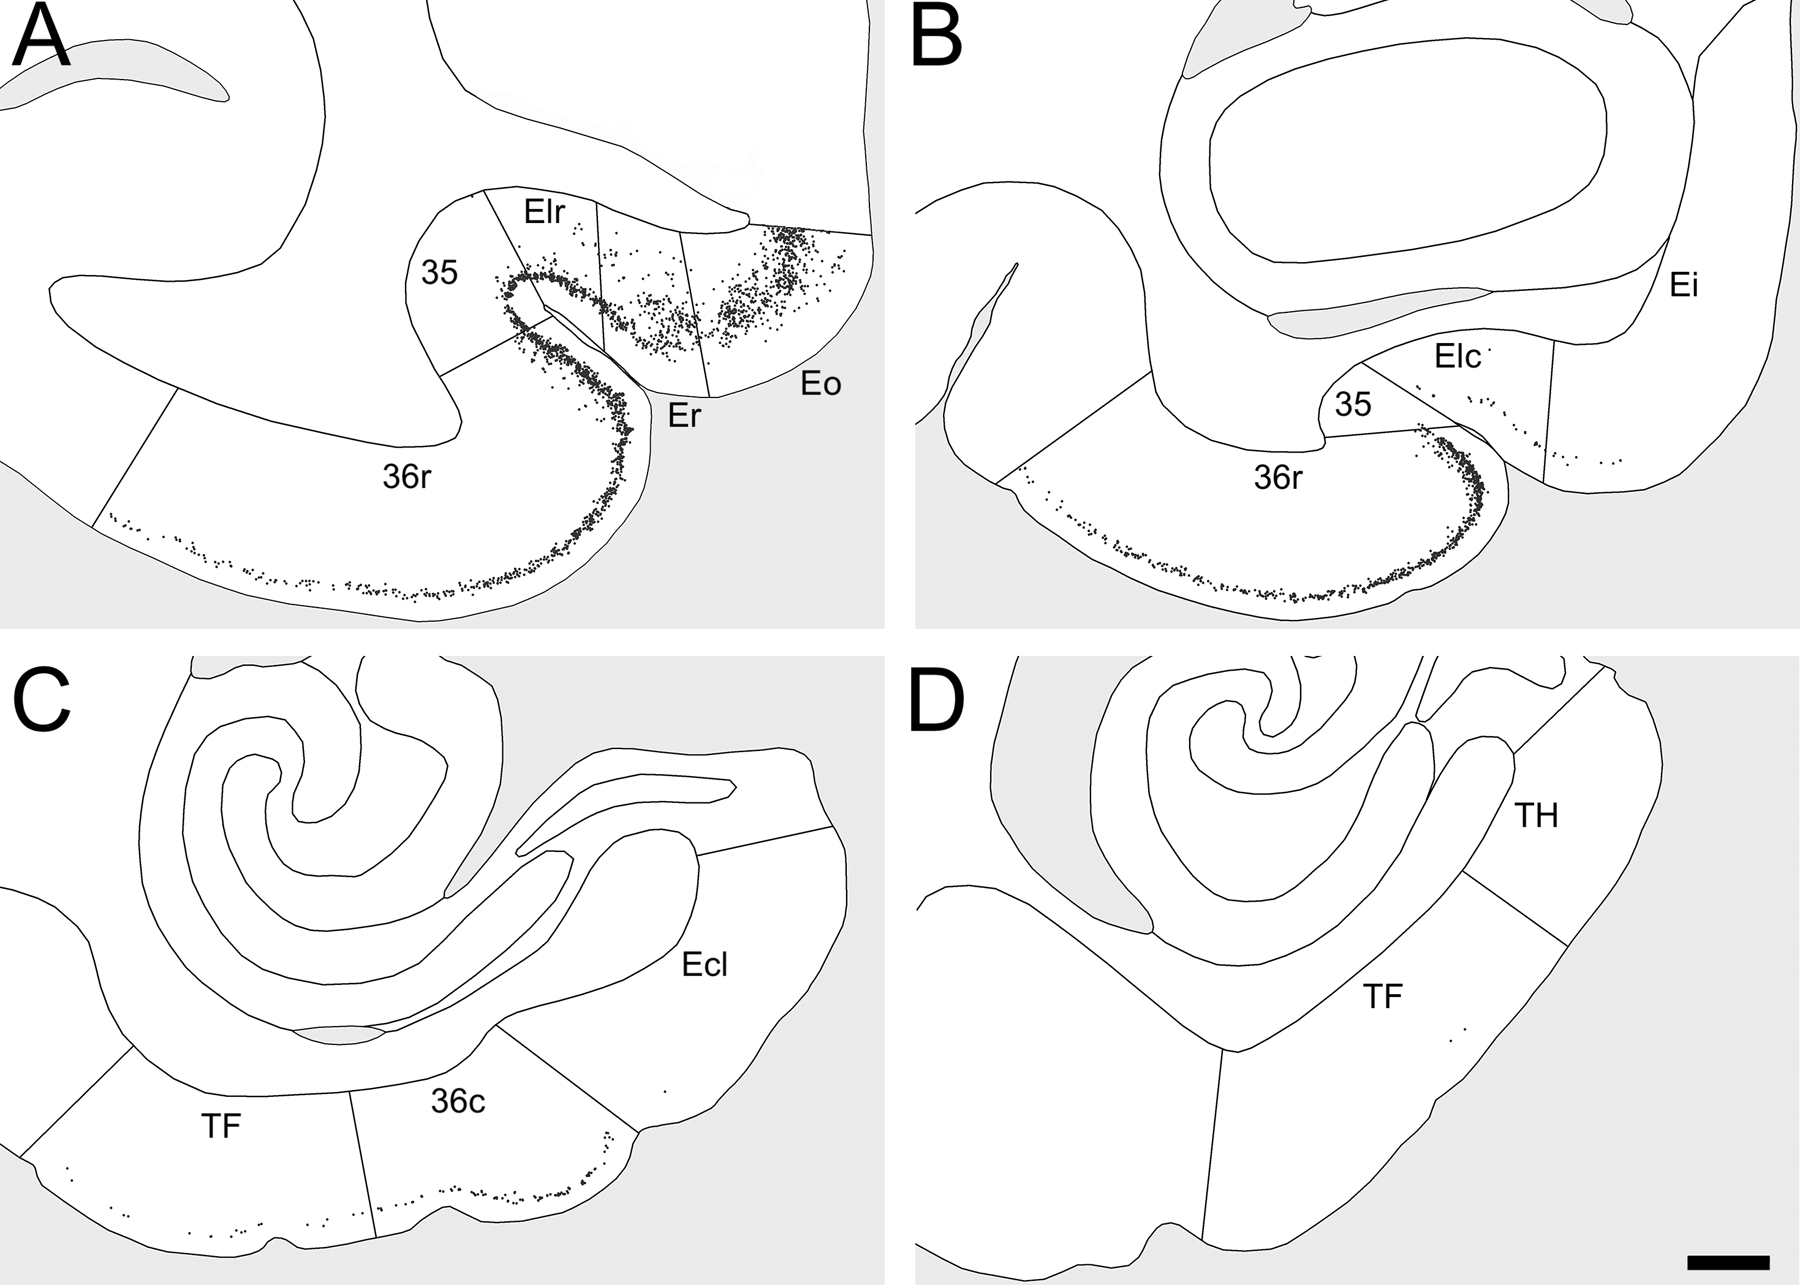
Figure 3.

Distribution of Bcl2+ cells in the distinct subdivisions of the entorhinal, perirhinal and parahippocampal cortices of a control monkey. Note that Bcl2+ cells in adjacent brain regions are not represented. A. Bcl2+ cells in areas Eo, Er and Elr of the entorhinal cortex and in areas 35 and 36r of the perirhinal cortex. B. Bcl2+ cells in areas Ei and Elc of the entorhinal cortex and in areas 35 and 36r of the perirhinal cortex. C. Bcl2+ cells in area Ecl of the entorhinal cortex, area 36c of the perirhinal cortex and area TF of the parahippocampal cortex. D. Bcl2+ cells in areas TF and TH of the parahippocampal cortex. Scale bar for all panels, 1 mm.
