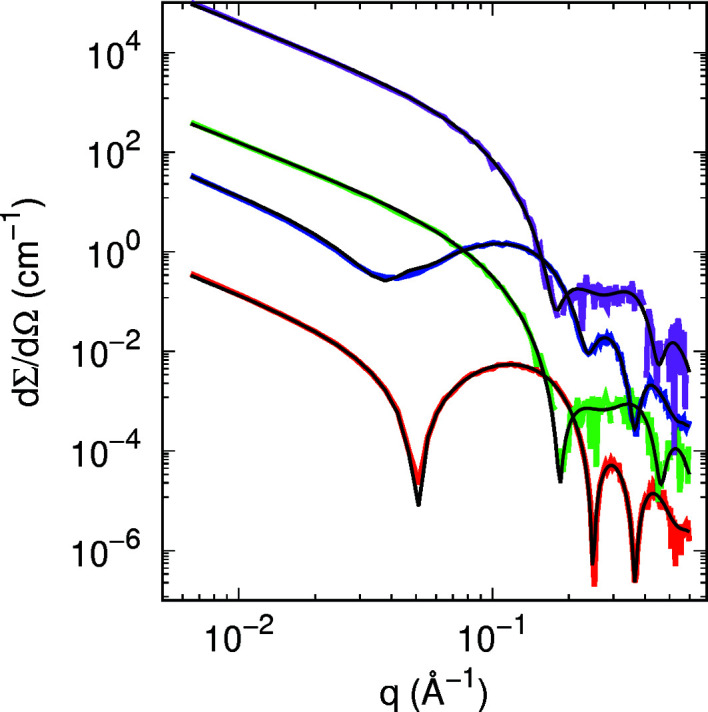
Figure 4.

Best global fits (black lines) of simulated SAXS (red and blue lines) and SANS (green and magenta lines) curves of 3 mM DPPC and DOPC domains in 3 mM DPPC, respectively (g a = 0.3, a = 150 Å, R 1 = 60 Å, corresponding to C DOPC = 3.94 mM). The simulated curves have been randomly moved by sampling from a Gaussian distribution with standard deviation proportional to [dΣ/dΩ(q)]1/2. Curves are vertically displaced for clarity.
