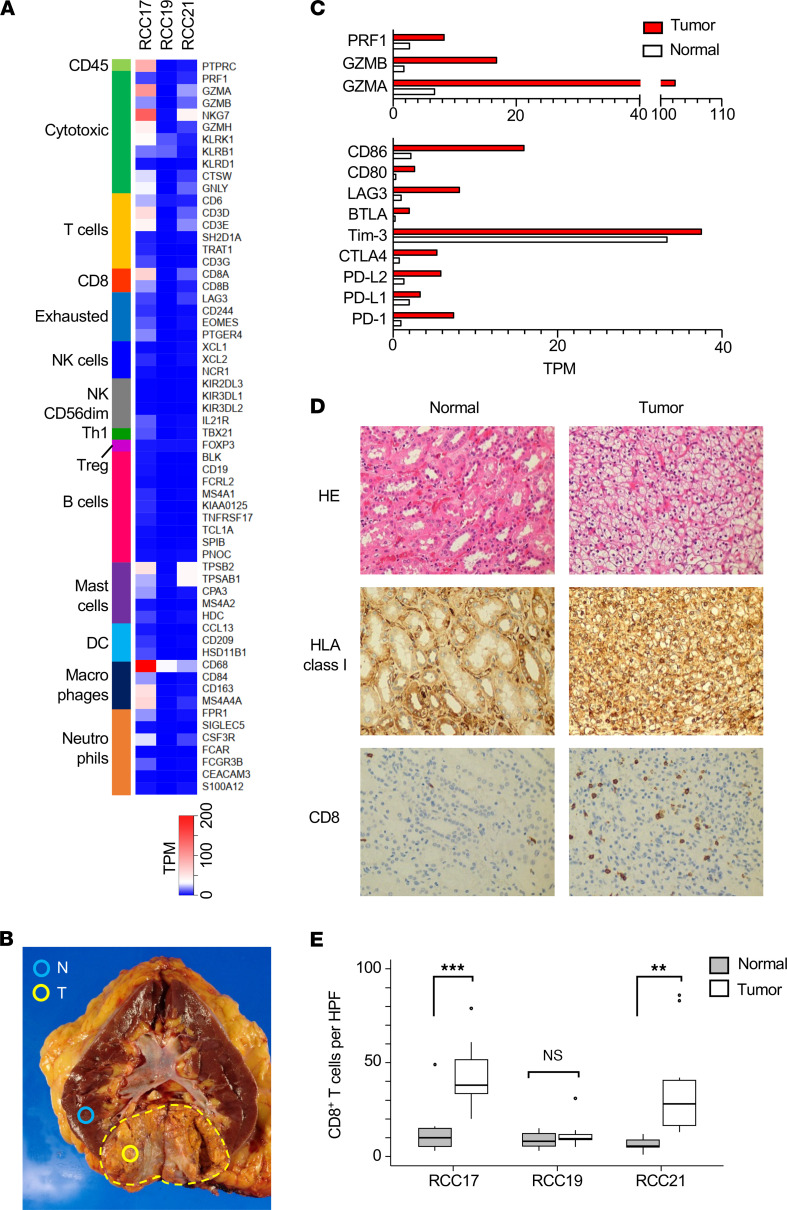
Figure 1. Immune profiling of the RCC tissues.
(A) Expression of immune-related genes in RCC tissues (RCC17, RCC19, and RCC21). (B) Section of the RCC17 kidney showing tumor (T) and normal (N) lesions sampled and used in this study. The dashed line indicates the capsule surrounding the tumor mass. (C) Comparison of the expression levels of genes related to cytotoxic T cells (top) and costimulatory or immune checkpoint molecules (bottom) between normal and tumor tissues of RCC17. (D) IHC of RCC17 tumor and normal tissues (total original magnification, ×200). (E) Numbers of CD8+ cells per HPF in RCC17, RCC19, and RCC21 tissues. Box-and-whisker plots represent the median (solid bars), interquartile range (boxes), and 1.5× interquartile range (vertical lines). P values were calculated using 2-tailed t test. ***P < 0.001, **P < 0.01.

