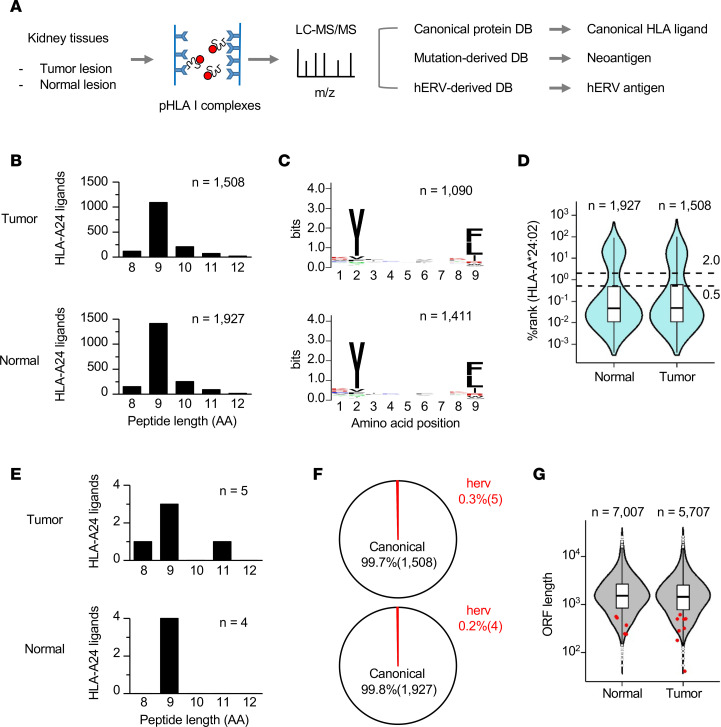
Figure 2. Landscape of the immunopeptidome presented by HLA-A24 of RCC.
(A) Workflow of the proteogenomic analysis exploring the immunopeptidomes of normal and tumor tissues. pHLA-A24 complexes were captured from RCC17 tumor and normal tissues using a specific antibody, and the eluted peptides were subsequently analyzed by MS. The use of personalized custom databases enabled MS sequencing to detect peptides derived from hERVs. (B) Length distribution of canonical peptides identified in normal and tumor tissues. Each bar indicates the number of identified peptides. (C) Logo sequence showing the conserved amino acids at each position across all 9 mer peptides. (D) Violin plot showing the percentile rank scores (NetMHCpan4.1) of the identified peptides. The dashed lines indicate the thresholds for strong (0.5) and weak (2.0) HLA-A24 binders defined by NetMHCpan4.1. (E) Length distribution of hERV-derived peptides identified in normal and tumor tissues. Each bar indicates the number of identified peptides. (F) Pie charts showing the frequency of hERV-derived peptides among the identified peptides. (G) Violin plot showing the nucleotide lengths of source ORFs encoding the identified peptides. The red dots indicate the distribution of ORFs encoding hERV-derived peptides. Box-and-whisker plots represent the median (solid bars), interquartile range (boxes), and 1.5× interquartile range (vertical lines). The dots denote observations outside the range of adjacent values.

