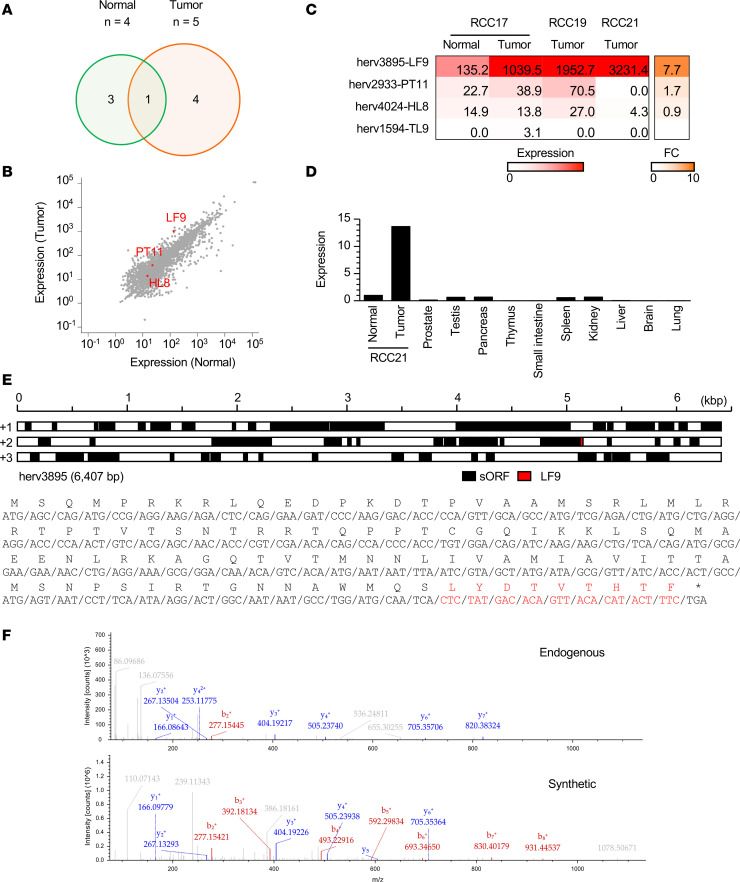
Figure 3. Search of the immunopeptidome for tumor-associated hERV antigens.
(A) Venn diagram showing the number of hERV-derived peptides exclusive to RCC17 tumor and normal tissues. (B) Differential gene expression of hERVs in tumor and normal tissues. hERVs encoding peptides exclusive to the tumor are shown in red. (C) Gene expression of the 4 hERV transcripts across 3 RCC tissues. Each fold change (FC) indicates the expression ratio (tumor/normal) in RCC17. (D) hERV3895 expression across normal tissues measured by qPCR (y axis, FC relative to RCC21 normal tissue). (E) Schematic representation of the hERV3895 transcript. Each black box indicates a potential ORF encompassed with ATG and a stop codon. The red box indicates the positions of sequences encoding LF9 (top). Amino acid sequences translated from the ORF encoding LF9 are also shown (bottom). LF9 is shown in red. (F) MS/MS spectra and corresponding b- and y-fragment ions of endogenous and synthetic LF9 peptides.

