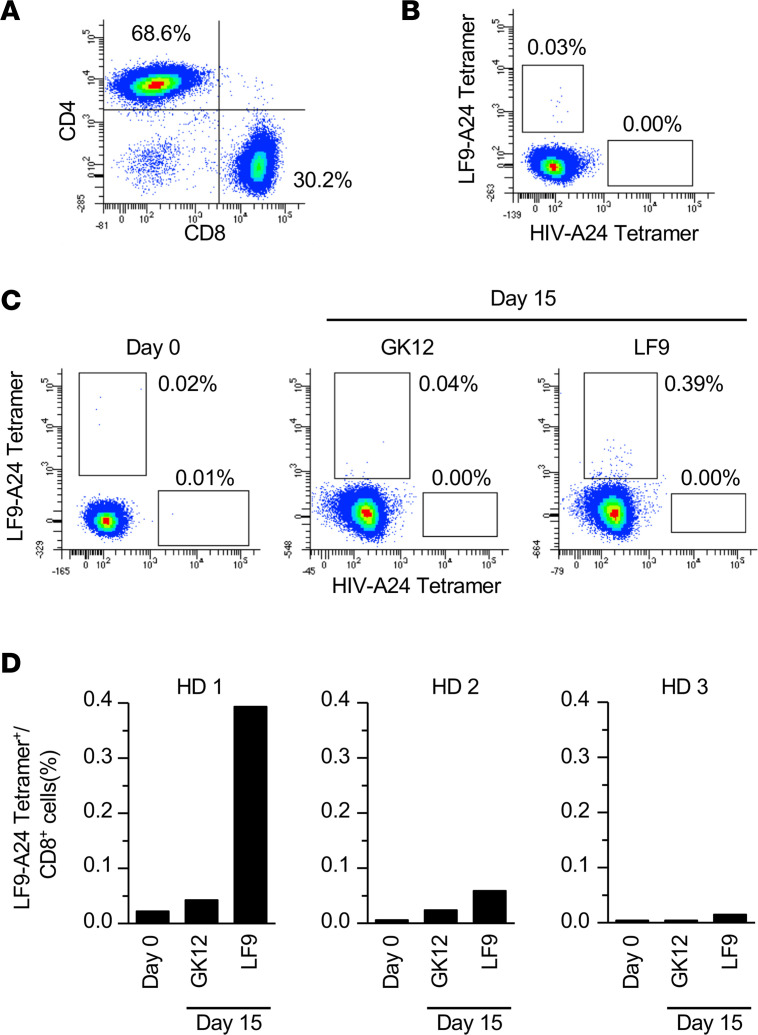
Figure 4. T cell surveillance against the hERV-derived antigen, LF9.
(A) Flow cytometry of TILs obtained from RCC17 tumor tissue. The TILs were analyzed after in vitro expansion. The data are representative of 3 independent experiments. (B) Frequency of CD8+ T cells recognizing the LF9–HLA-A24 complex in RCC17 TILs. Staining with the HIV–HLA-A24 tetramer served as a negative control. The data are representative of 3 independent experiments. (C) Frequency of CD8+ T cells recognizing the LF9–HLA-A24 complex. PBMCs from healthy donors (HD1) were stimulated with the LF9 or an irrelevant peptide (GK12) for 14 days in vitro, and the frequency was measured by flowcytometry. (D) Summary of the frequency in different individuals (HD1, HD2, and HD3) after 14-day stimulation with LF9 or GK12.

