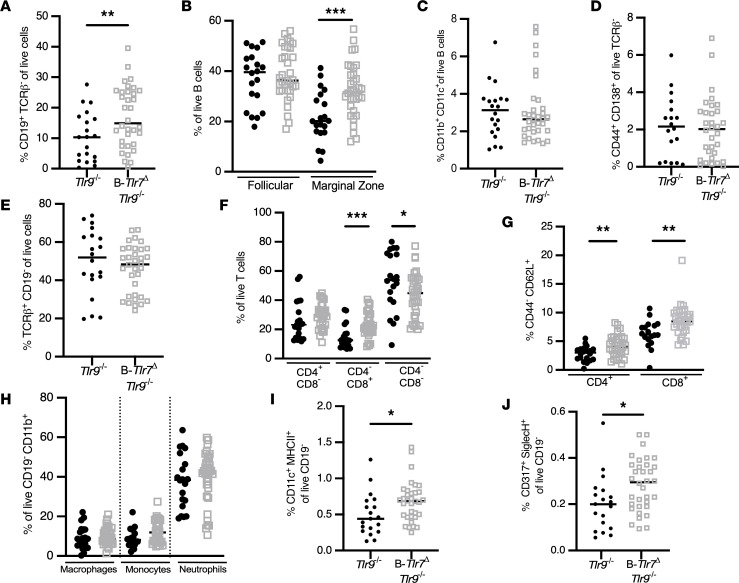
Figure 6. B cell–intrinsic TLR7 drives naive T cell activation, double-negative T cell expansion, and B cell lymphopenia in TLR9-deficient mice.
Flow cytometric analysis was performed on spleens from control (Tlr7fl/fl Tlr9–/– and Tlr7fl/y Tlr9–/–, solid black circles) and B-Tlr7Δ Tlr9–/– (CD19-Cre+/– Tlr7fl/fl Tlr9–/– and CD19-Cre+/– Tlr7fl/y Tlr9–/–, open gray squares) mice. (A–D) Analysis of the B cell compartment in control versus B-Tlr7Δ Tlr9–/–, including proportions of B cells as percent of total live cells (A), follicular and marginal zone B cells as a percent of total B cells (B), CD11b+CD11c+ ABCs as a percent of total B cells (C), and plasmablasts as a percent of total TCRβ– cells (D). (E–G) Analysis of the T cell compartment in control versus B-Tlr7Δ TLR9–/–, including proportions of T cells as a percent of total live cells (E); CD4+, CD8+, and double-negative (CD4–CD8–) T cells as a percent of total T cells (F); and percent naive CD4+ and naive CD8+ T cells as a percent of CD4+ and CD8+ T cells, respectively (G). (H–J) Analysis of selected myeloid populations, including proportions of macrophages, monocytes, and neutrophils as a percent of total CD19–CD11b+ cells (H); cDCs as a percent of total CD19– cells (I); and pDCs as a percent of total CD19– cells (J). Scatterplots display data from individual mice, with black lines showing median values. *P < 0.05, **P < 0.01, ***P < 0.001, by 1-tailed Mann-Whitney U test.

