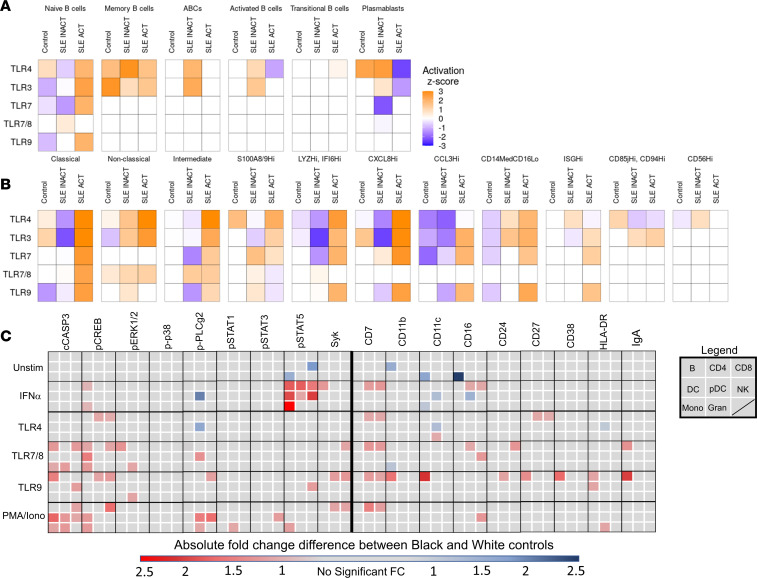
Figure 6. TLR activation pathways are elevated with disease activity in Black patients.
Differentially expressed genes between Black and White samples identified by scRNA-Seq (n = 46) of (A) B cells and (B) monocyte cell clusters were assessed by IPA to determine ancestral differences in the activity of TLR pathways by activation z scores. Orange indicates increased TLR pathway activity in Black patients, white indicates no difference, and blue indicates increased TLR activity in White patients. (C) Peripheral whole blood (n = 56) from controls and patients with SLE was stimulated for 4 or 15 minutes with IFN-α and PMA/ionomycin or TLR4, TLR7/8, or TLR9 agonists. The median 95th percentile was used to calculate the fold-change of phospho-signaling and activation markers in Black versus White controls in 8 cell populations (see legend: B cells, CD4+ T cells, CD8+ T cells, DCs, pDCs, NK cells, monocytes [Mono], and granulocytes [Gran]). Statistical significance was determined using a Mann-Whitney U test and FDR P < 0.05, and significant changes are noted by a blue box (decrease) or a red box (increase).

