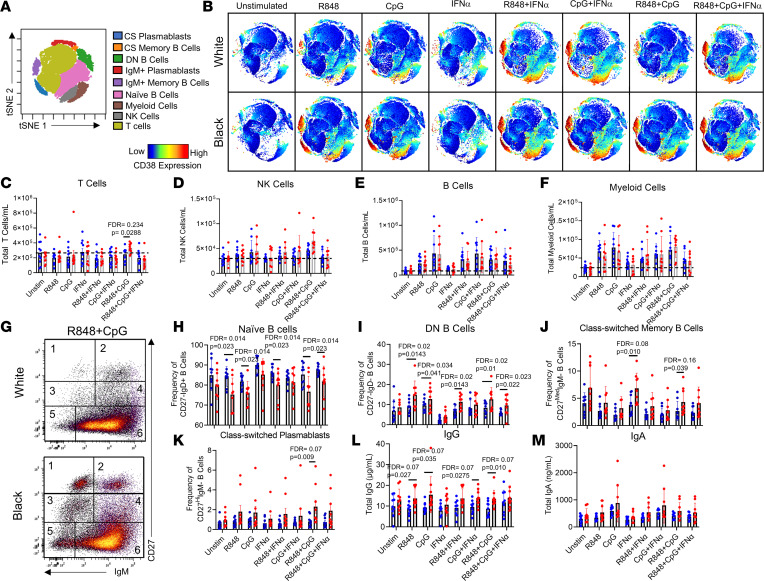
Figure 7. TLR stimulation of healthy Black and White immune cells recapitulates ancestry-associated SLE immunophenotypes.
One million PBMCs from 10 White and 10 Black healthy controls, devoid of any autoimmune characteristics (ANA–, RF, CCP3 antibody negative, and negative CSQ), were stimulated with R848 (TLR7/8 agonist), CpG (TLR9 agonist), or IFN-α alone or in combination for 7 days and analyzed by flow cytometry. (A) tSNE plots identified 9 different immune cell populations across samples. (B) Representative tSNE plots of healthy White and Black cells following the 9 different stimulation conditions. CD38 expression is shown from red (high expression) to blue (low expression). Cells were counted in culture following 7-day stimulation, and total cell subset numbers were back-calculated using cell frequencies. The total (mean ± SD) (C) T cells, (D) NK cells, (E) B cells, and (F) myeloid cells/mL are shown for the 8 different stimulations by ancestry. (G) B cells were further subdivided by biaxial gating on IgM and CD27 to assess 6 different B cell subsets: 1) class-switched plasmablasts, 2) IgM+ plasmablasts, 3) class-switched memory B cells, 4) IgM+ memory B cells, 5) DN B cells, and 6) naive B cells. The frequency (mean ± SD) of (H) naive B cells, (I) DN B cells, (J) class-switched memory B cells, and (K) class-switched plasmablasts is shown for each condition. Supernatants were collected and assessed via ELISA for (L) total IgG concentrations and (M) IgA concentrations. Statistical significance was determined using a Mann-Whitney U test (P < 0.05), and all FDR q values were used for multiple comparisons.

