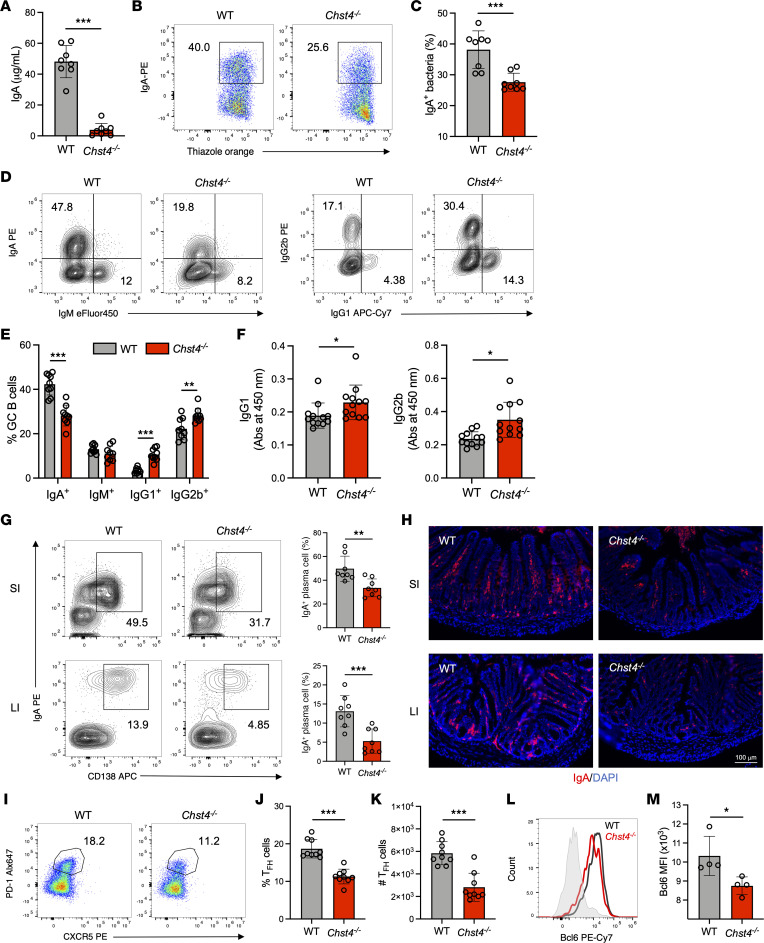
Figure 5. Deficiency of GlcNAc-6-O-sulfation is accompanied by altered antibody class switching and reduced intestinal IgA production caused by an impaired Tfh cell/GC B cell axis.
(A) Soluble IgA in feces was measured by ELISA. (B and C) Frequency of IgA-binding bacteria was determined by flow cytometry (n = 8). (D) Representative flow cytometry plot of GC B cells, which are defined as CD45+CD19+Fas+GL7+, from WT and Chst4–/– mice. (E) Frequency of IgA+, IgM+, IgG1+, and IgG2b+ GC B cells shown in D (n = 9). (F) Measurement of fecal IgG1 and IgG2b by ELISA. (G) Representative flow cytometry plot and frequency of plasma cells in the small and large intestine, defined as CD45+B220–CD138+IgA+ (n = 8). (H) Immunofluorescent staining of IgA in the small (SI) and large intestine (LI). Scale bar: 100 μm. (I) Representative flow cytometry plot of Tfh cells defined as CD45+CD4+CD25–CD44+PD-1+CXCR5+. (J) Frequency of Tfh cells shown in H. (K) Absolute cell number of Tfh cells shown in H (n = 9). (L) Expression of Bcl6 in Tfh cells was analyzed using flow cytometry. (M) MFI of Bcl6 shown in K (n = 4). Data are representative of 2 independent experiments, and presented as the mean ± SD. *P < 0.05, **P < 0.01, ***P < 0.001 via unpaired, 2-tailed t test.

