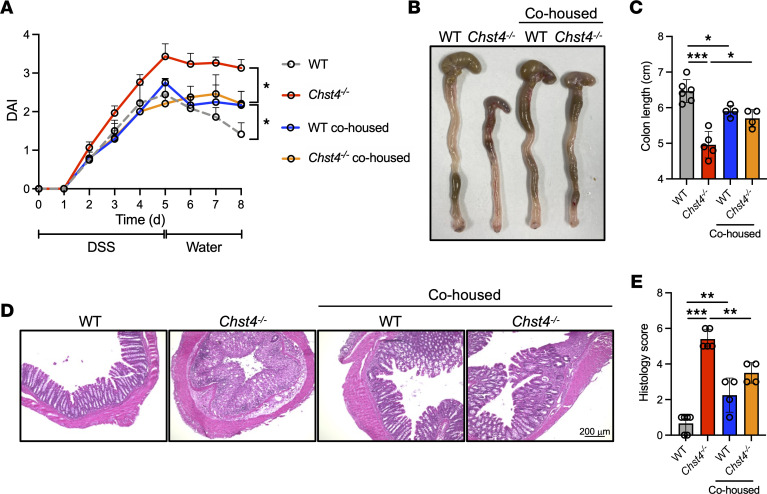
Figure 7. Modulation of gut microbiota rescues intestinal inflammation.
(A) DAI score of mice treated with DSS for 5 days, followed by drinking water for 4 days. (B) Images of colons from WT and Chst4–/– mice. (C) Colon length of mice shown in B. (D) Representative image of H&E-stained colonic tissues. Scale bar: 200 μm. (E) Histology scores of mice shown in D (WT n = 6, WT/cohoused n = 4, Chst4–/– n = 5, Chst4–/–/cohoused n = 4). Data are representative of 2 independent experiments, and presented as the mean ± SD. *P < 0.05, **P <0.01, ***P < 0.001 via 2-way ANOVA followed by Tukey’s multiple-comparison test (A) or 1-way ANOVA (C and E).

