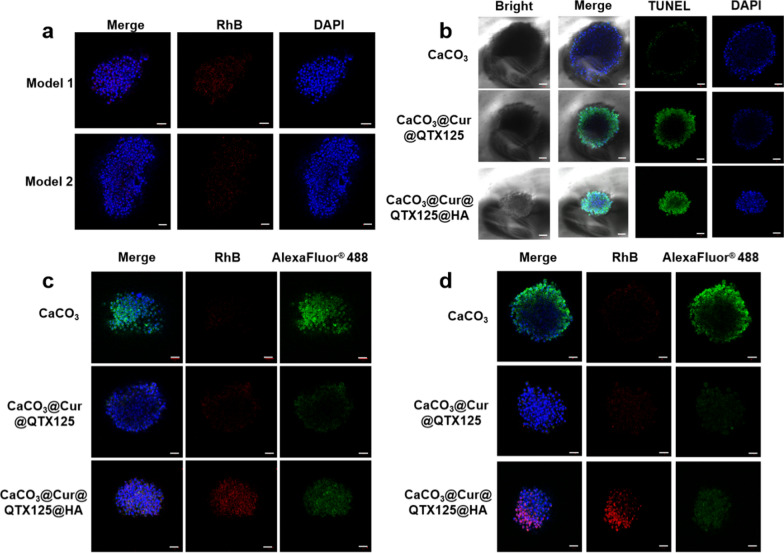
Fig. 6.
a CaCO3@Cur@QTX125@HA Image of the Z-stack in the PDO model of colorectal cancer. Blue: DAPI-labeled nucleus, red: nanoparticles labeled with RhB). Scale bar: 50 μ m; b Representative confocal images of PDO models after treatment with CaCO3, CaCO3@Cur@QTX125 and CaCO3@Cur@QTX125@HA nanoparticles, measured by TUNEL assay. c Expression of tumor marker CEA in CRC PDO model after incubation with CaCO3, CaCO3@Cur@QTX125 and CaCO3@Cur@QTX125 @HA nanoparticles at a Cur concentration of 20 μg/mL; d Expression of tumor marker CA19-9 in CRC PDO model after incubation with CaCO3, CaCO3@Cur@QTX125 and CaCO3@Cur@QTX125@HA nanoparticles at a Cur concentration of 20 μg/mL. The nuclei were labeled with DAPI in blue, Cur were labeled with Rhodamine B in red, and tumor markers were labeled with AlexaFluor® 488 in green. The scale bars represent 50 μm

