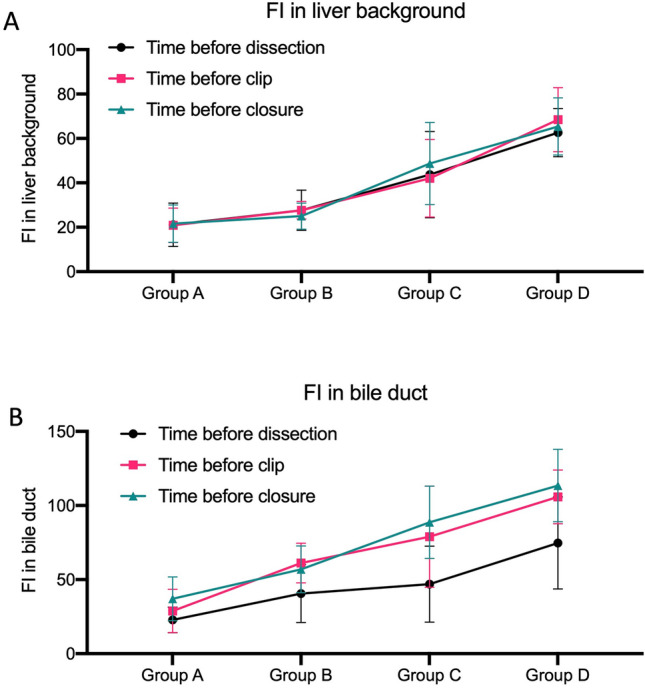
Fig. 3.

Levels of the fluorescence intensity (FI) in the liver background and bile duct. A shows the FIs in the liver background at the three measurement time points: before surgical dissection of the cystohepatic triangle (black line), before clipping the cystic duct (red line), and before closure (blue line); B shows the FIs in the bile duct before surgical dissection of the cystohepatic triangle (black line), before clipping the cystic duct (red line), and before closure (blue line). FI fluorescent intensity
