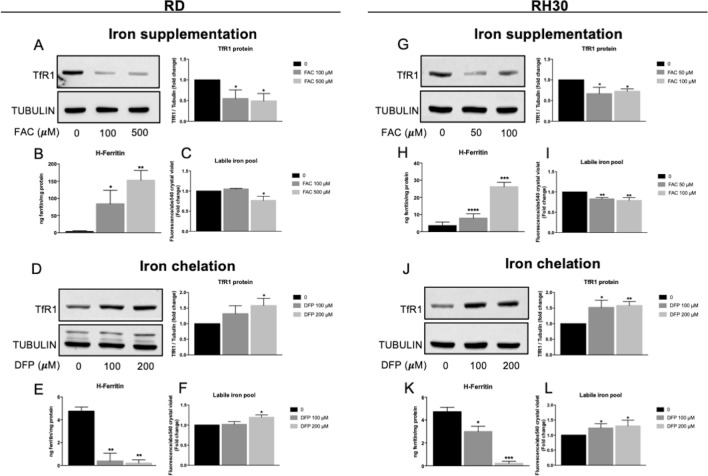
Fig. 2.
Short-term iron supplementation or iron chelation affected TfR1, ferritin and Labile Iron Pool. RD and RH30 cell lines treated with 100–500 µM or 50–100 µM of ferric ammonium citrate (FAC), respectively, or 100–200 µM Deferiprone (DFP) for 16 h. A, D, G, J) Western blot analysis for Transferrin Receptor1 (TfR1) in RD and RH30 cell lines. Tubulin was used as loading control. Densitometric analysis were performed using ImageJ software and data expressed as fold change over the untreated control cells (0) (N = 3). B, E, H, K) ELISA assay for H-ferritin in RD and RH30 cell lines (N = 3). C, F, I, L) Calcein-AM assay for the detection of Labile iron pool (LIP) in RD and RH30 cell lines. The values are expressed as ratio between the fluorescence detected and the absorbance at 540 nm after Crystal violet normalization. The differences were considered as significant for: **P < 0.01, *P < 0.05

