. 2023 Jul 21;83(19):3305–3319. doi: 10.1158/0008-5472.CAN-23-0128

Figure 1.

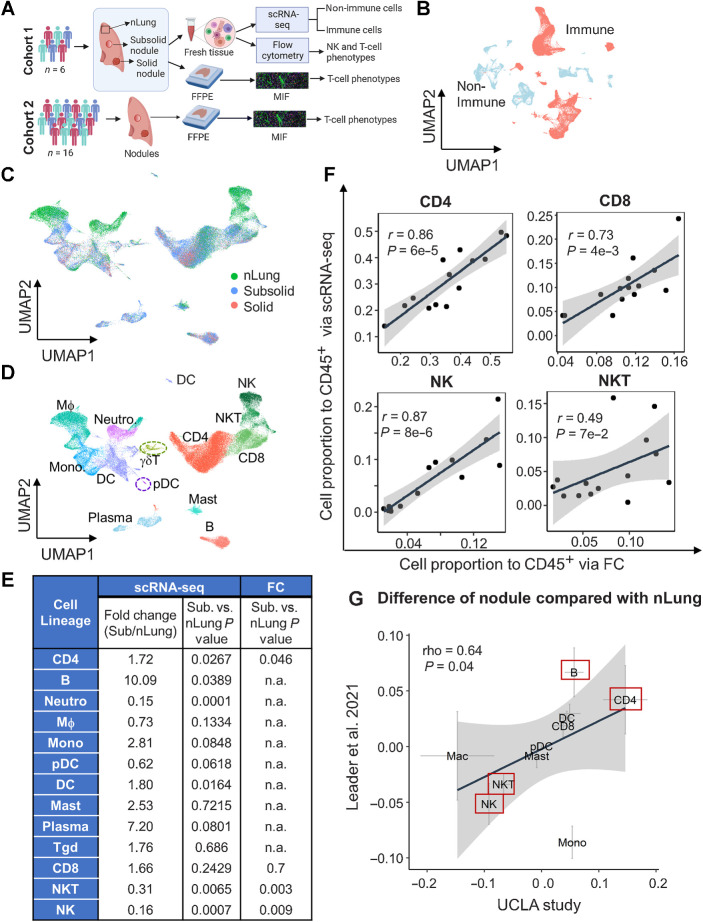
Figure 1. Single-cell transcriptional profiling of human immune cells in lung nodules and associated normal lung tissue. A, Schematic of cohorts and assays used in this study. B, UMAP plot of immune (red) and nonimmune cells (light blue). C and D, UMAP plot visualizing immune cell clusters colored by tissue types (C) and cell lineages (D), including NK, NKT, CD8, CD4, γδT, B, plasma, mast, DC, pDC, macrophages (MΦ), monocytes (Mono), and neutrophils (Neutro). E, Summary of fold change and their statistical P values between subsolid nodules and nLung for each cell lineage based on scRNA-seq and FC. P values were calculated by the LME model. The abundance of myeloid and B cells was not subjected to assessment (n.a.) by FC. F, Correlation of relative abundance of T (CD4+, CD8+, and NKT) and NK cells identified by scRNA-seq and FC. G, Difference between Stage I tumor (subsolid and solid nodules) and nLung in the UCLA (x-axis) and Leader and colleagues (9) studies (y-axis). Crosses represent mean ± SEM. Red boxes emphasize top lineages altered in both cohorts. (A, Created with BioRender.com.)

Single-cell transcriptional profiling of human immune cells in lung nodules and associated normal lung tissue. A, Schematic of cohorts and assays used in this study. B, UMAP plot of immune (red) and nonimmune cells (light blue). C and D, UMAP plot visualizing immune cell clusters colored by tissue types (C) and cell lineages (D), including NK, NKT, CD8, CD4, γδT, B, plasma, mast, DC, pDC, macrophages (MΦ), monocytes (Mono), and neutrophils (Neutro). E, Summary of fold change and their statistical P values between subsolid nodules and nLung for each cell lineage based on scRNA-seq and FC. P values were calculated by the LME model. The abundance of myeloid and B cells was not subjected to assessment (n.a.) by FC. F, Correlation of relative abundance of T (CD4+, CD8+, and NKT) and NK cells identified by scRNA-seq and FC. G, Difference between Stage I tumor (subsolid and solid nodules) and nLung in the UCLA (x-axis) and Leader and colleagues (9) studies (y-axis). Crosses represent mean ± SEM. Red boxes emphasize top lineages altered in both cohorts. (A, Created with BioRender.com.)