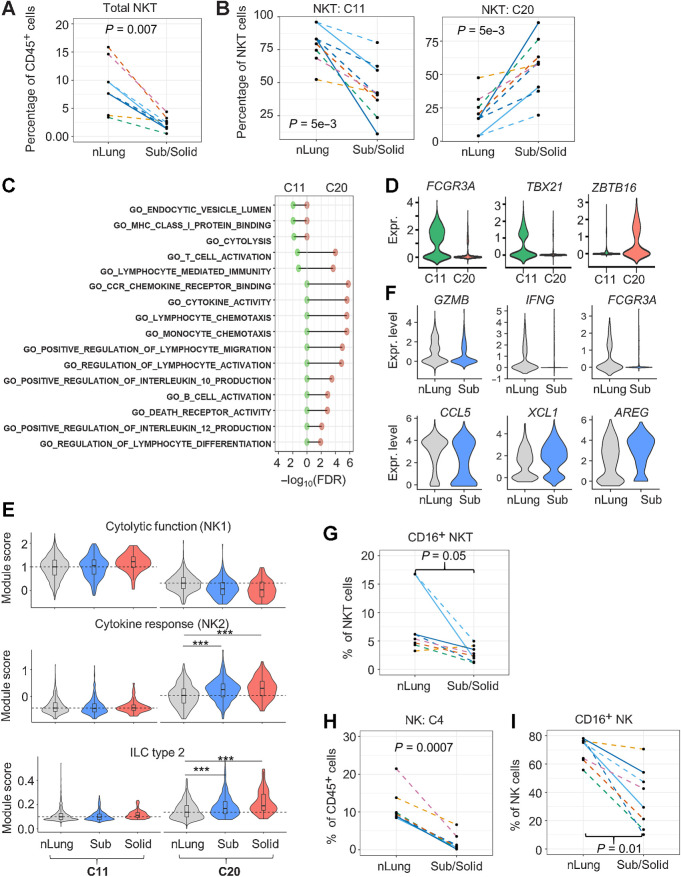
Figure 2.
Reduction of infiltrating cytolytic NKT and NK cells in subsolid nodules. A, Relative abundance of NKT cells among CD45+ cells in each sample (dot). B, The percentage of NKT subtypes in each sample (dot). C, Immune-regulated pathways enriched by markers identified in NKT clusters, C11 (left) and C20 (right). D, NKT marker expression (Expr.) associated with cytolytic activity (FCGR3A/CD16) and NKT subtypes 1 (TBX21) and 2 (ZBTB16). E, Violin plots illustrating the distribution of the functional NKT gene module scores in various clusters and nodule types. Dashed lines represent the median scores of nLung cells in the selected clusters. ***, P < 1e−10 based on the rank-based Wilcoxon test. F, Top DEGs (P < 1e−5) between nLung and nodule-associated C20 NKT cells. G, Relative abundance of CD16+ NKT cells in each sample (dots) assessed by FC. H, Relative abundance of NK cells (cluster 4) to total immune cells by scRNA-seq. I, Relative abundance of CD16+ NK cells by FC. Each dot in spaghetti plots (A,B, and G–I) represents a sample, with colors representing individual patients. Line patterns indicate the nLung-subsolid (dashed) and nLung-solid (solid) relationships from the same patient. P values were calculated on the basis of the LME model to compare either subsolid nodules (A, B, and I) or both sub- and solid nodules (G and H) and nLung. Data points of solid nodules (A, B, and I) illustrate observations in subsolid were consistent with those in matched solid nodules.

