. 2023 Jul 21;83(19):3305–3319. doi: 10.1158/0008-5472.CAN-23-0128

Figure 3.

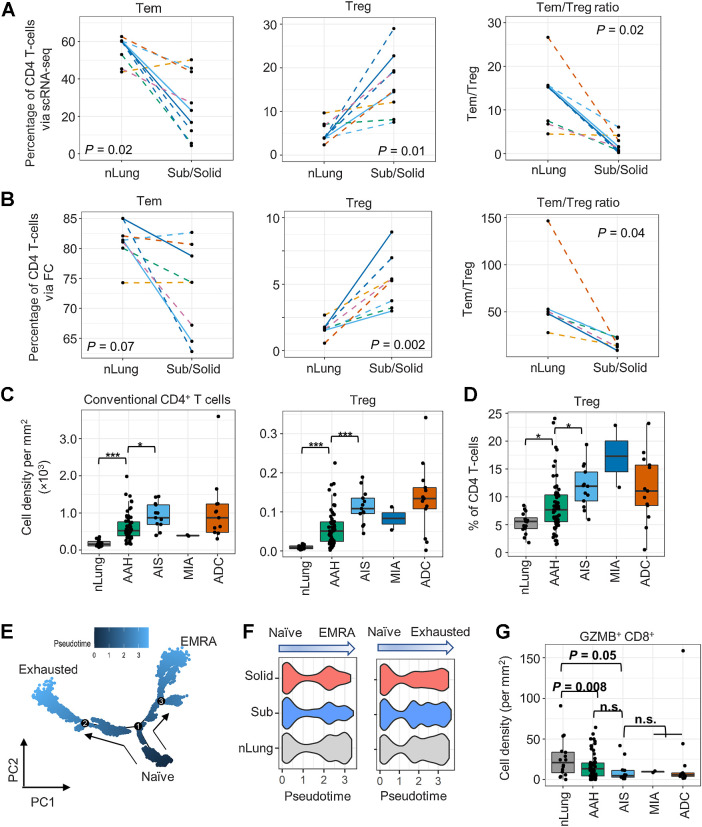
Figure 3. Profiles of the CD4+ T-cell subsets in subsolid nodules. A and B, The percentage of CD4+ T cells identified as Tem and Treg cells and Tem:Treg ratio in each sample (dot) via scRNA-seq (A) and FC (B) in the perspective cohort. Line patterns indicate the nLung-subsolid (dashed) and nLung-solid (solid in A and B) relationships from the same patients. C and D, Densities of conventional CD4+ and Treg (C) and percentage of Treg to total CD4+ T cells (D) evaluated by MIF staining in tissue areas (dot) associated with histology (x-axis) in the retrospective cohort. E, Illustration of CD8+ T-cell differentiation pathways inferred by Monocle. F, Distribution of pseudotime scores (x-axis) in tissue types (y-axis) for each differentiation path. G, Density of GZMB+CD8+ T cells in tissue area (dots) associated with histology (x-axis) in the retrospective cohort. n.s., nonsignificant.

Profiles of the CD4+ T-cell subsets in subsolid nodules. A and B, The percentage of CD4+ T cells identified as Tem and Treg cells and Tem:Treg ratio in each sample (dot) via scRNA-seq (A) and FC (B) in the perspective cohort. Line patterns indicate the nLung-subsolid (dashed) and nLung-solid (solid in A and B) relationships from the same patients. C and D, Densities of conventional CD4+ and Treg (C) and percentage of Treg to total CD4+ T cells (D) evaluated by MIF staining in tissue areas (dot) associated with histology (x-axis) in the retrospective cohort. E, Illustration of CD8+ T-cell differentiation pathways inferred by Monocle. F, Distribution of pseudotime scores (x-axis) in tissue types (y-axis) for each differentiation path. G, Density of GZMB+CD8+ T cells in tissue area (dots) associated with histology (x-axis) in the retrospective cohort. n.s., nonsignificant.