. 2023 Jul 21;83(19):3305–3319. doi: 10.1158/0008-5472.CAN-23-0128

Figure 4.

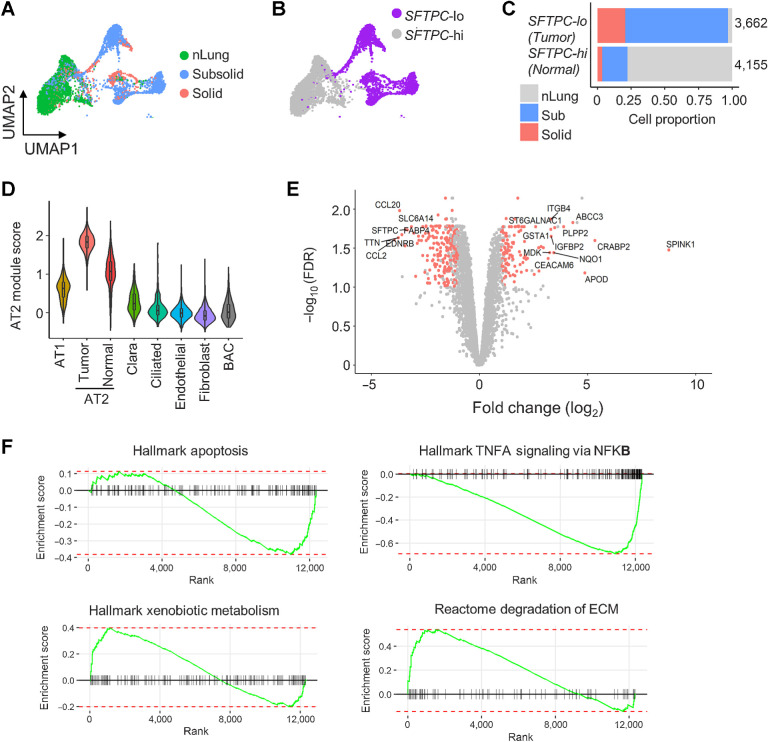
Figure 4. Deregulation of AT2 cells in subsolid nodules. A, AT2 cells from sub- and solid nodules cluster separately from AT2 cells from matching nLung. Colors represent nodule types. B, Two major AT2 clusters identified on the basis of high (hi) or low (lo) SFTPC expression. C, Proportions of SFTPC-high and -low cells obtained from nodules and nLung. Values indicate cell numbers in the respective groups. Colors indicate tissue types. D, Violin plots of module scores representing AT2 lineage marker expression in various nonimmune cell populations. E, Volcano plot representing DEGs between nodule- and nLung-derived AT2 cells. P values (y-axis) and fold changes (x-axis) were calculated by the edgeR approach. The red dots indicate DEGs identified by both edgeR and MAST approaches. F, GSEA plots of the top deregulated pathways in AT2 cells from subsolid/solid nodules compared with nLung.

Deregulation of AT2 cells in subsolid nodules. A, AT2 cells from sub- and solid nodules cluster separately from AT2 cells from matching nLung. Colors represent nodule types. B, Two major AT2 clusters identified on the basis of high (hi) or low (lo) SFTPC expression. C, Proportions of SFTPC-high and -low cells obtained from nodules and nLung. Values indicate cell numbers in the respective groups. Colors indicate tissue types. D, Violin plots of module scores representing AT2 lineage marker expression in various nonimmune cell populations. E, Volcano plot representing DEGs between nodule- and nLung-derived AT2 cells. P values (y-axis) and fold changes (x-axis) were calculated by the edgeR approach. The red dots indicate DEGs identified by both edgeR and MAST approaches. F, GSEA plots of the top deregulated pathways in AT2 cells from subsolid/solid nodules compared with nLung.