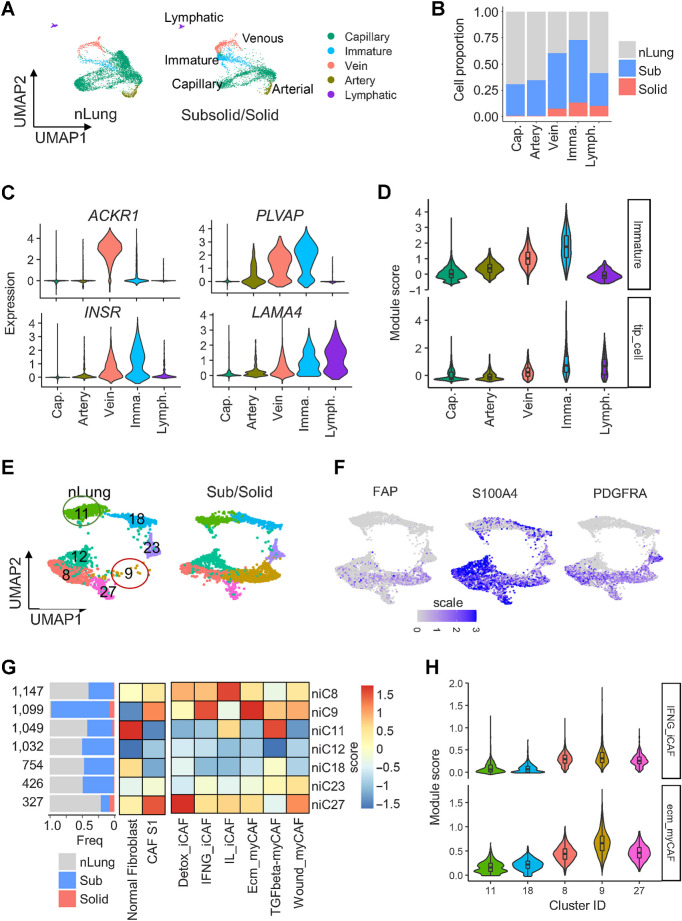
Figure 5.
Cancer-associated endothelial cells and fibroblasts enriched in subsolid nodules. A, UMAP plot visualizing the distribution of five EC subtypes in nLung and subsolid/solid nodules. B, Proportion of EC subtypes in nodules and normal lung. Cap, capillary; Imma, immature; Lymph, lymphatic EC. Color indicates tissue type. C, Expression of top DEGs in cancer-associated clusters C14 and C15 compared with other EC clusters. D, Violin plots of module scores of cancer-associated immature stalk and tip-like signatures in EC clusters. E, UMAP plot visualizing seven fibroblast clusters in nLung (left) and subsolid/solid nodules (right). F, Expression of CAF subtype 1 (CAF-S1) markers in fibroblast clusters. G, Fibroblast clusters characterized by tissue-based contribution (left) and gene modules associated with normal fibroblasts, immune regulating CAF-S1 (middle), and six CAF-S1 subgroups (right). The horizontal bar plot (left) indicates tissue type proportions in each cluster. Heat maps represent average scores of gene modules (columns) in clusters (rows). H, Violin plots illustrating the distribution of ecm-myCAF and IFNG-iCAF signature scores in clusters expressing markers associated with normal fibroblast (niC11 and niC18) and immune-regulating CAF-S1 (niC8, 9, and 27).

