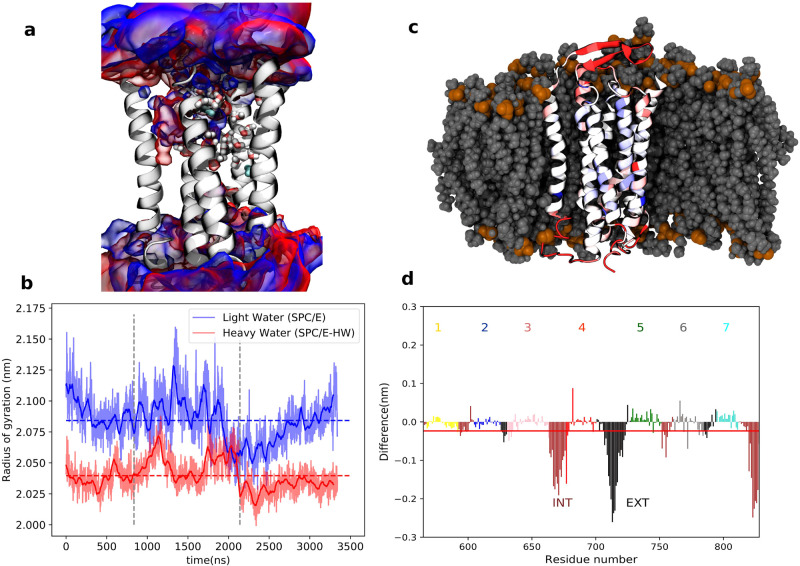
Figure 3.
Differences between the behavior of the transmembrane part of the human sweet taste receptor in H2O vs D2O. (a) Structure of the TMD of the TAS1R2/TAS1R3 receptor with the probability density (volumetric map) of H2O (blue) or D2O (red) molecules within 10 Å of the protein. The conserved water molecules in the X-ray templates are shown in cyan. Water molecules predicted with the software OpenEye52 are shown in licorice representation. (b) Time evolution of the radii of gyration in H2O (blue) and D2O (red) from three microsecond time scale simulations (separated by vertical dashed lines) with total mean values as dashed lines, showing that the protein is more compact in D2O. (c) Snapshot of the transmembrane part of the human sweet taste receptor color-coded that red/blue represents parts more/less rigid in D2O vs H2O. The embedding lipid membrane is represented in gray. (d) Difference in root-mean-square fluctuations in MD trajectories. Negative/positive values mean that structures are more/less rigid in D2O than in H2O. The red line represents the sum of all residues. INT, intracellular; EXT, extracellular. Adapted from ref (30), copyright 2021 Ben Abu et al. (licensed under CC BY).

