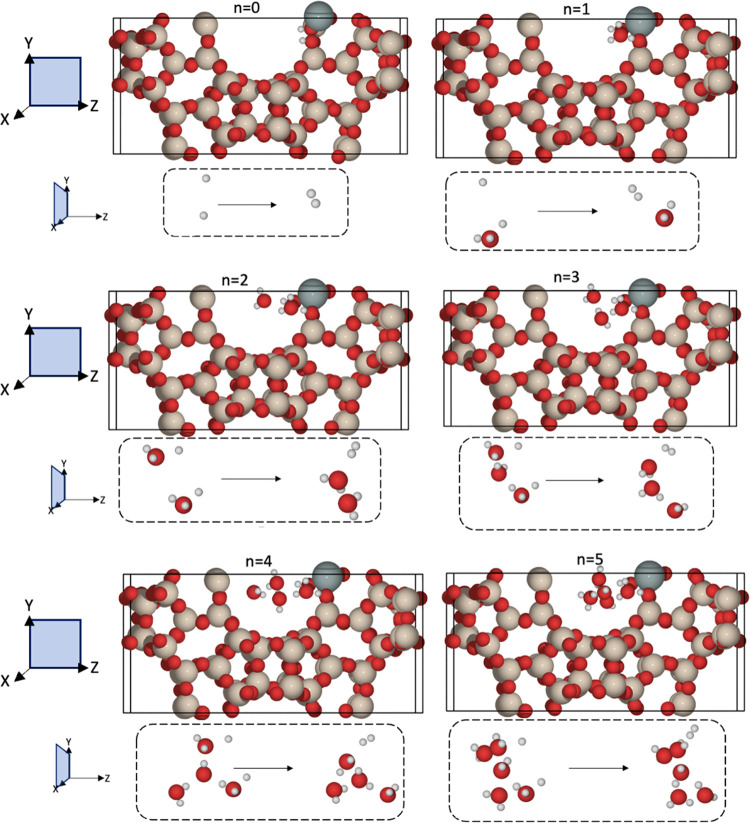
Figure 10.
Optimized structures for Sn(II)-β and Sn(IV)-β, with stabilized H2O clusters created around the Sn(II) site. Each image is labeled by n, which represents the number of H2O molecules in the model. The top figures in each case are viewed along the yz-plane for the complete simulation cell. The bottom figures, which are viewed along the xy-plane, show the change in structure during the conversion of Sn(II) to Sn(IV), with the production of H2 mediated by H2O (shown in the dashed black boxes). Red, beige, white, gray, and gray atoms represent O, Si, H, C, and Sn, respectively. Results for n = 0 and n = 3 are reused from ref (33).

